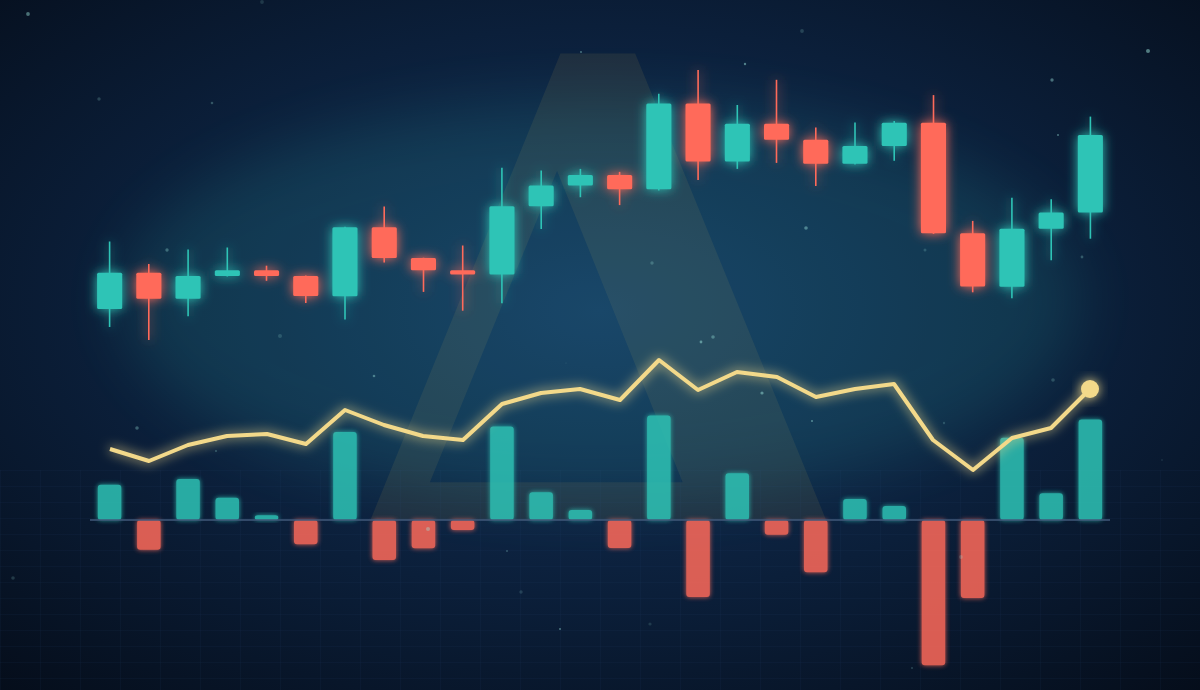
A price chart tells you where the market is.
It doesn’t tell you who took it there.
The same 20-point move up can be a sign of strength. It can also be the last gasp before a drop. On the candle alone they look identical.
You only see the difference in the order data. That’s where delta comes in.
What is delta?
There are two kinds of market participants.
Passive traders place limit orders and wait. They build the order book.
Aggressive traders don’t wait. They buy immediately at the ask or sell immediately at the bid. They are the ones who move price.
Delta measures how much one aggressive side outweighs the other:
Delta = volume bought at the ask − volume sold at the bid
A simple example
Within a single bar:
- aggressive buyers traded 1,200 contracts,
- aggressive sellers traded 800 contracts.
The delta of that bar is +400.
Buyers were more determined. They wanted in so badly that they paid the seller’s price.
Negative delta means the opposite. Sellers were “hitting the bid”.
Cumulative delta: the story of the session
A single bar is one sentence. Cumulative delta is the whole story.
We add up the delta of each bar from the start of the session. The result is a line that shows which side dominates over time.
- The line rises: buyers are consistently in control.
- The line falls: sellers are in control.
- A flat line while price is moving should raise a red flag.
The most interesting things happen where price and delta disagree.
Three situations worth recognizing
1. Confirmation
Price rises and cumulative delta rises with it.
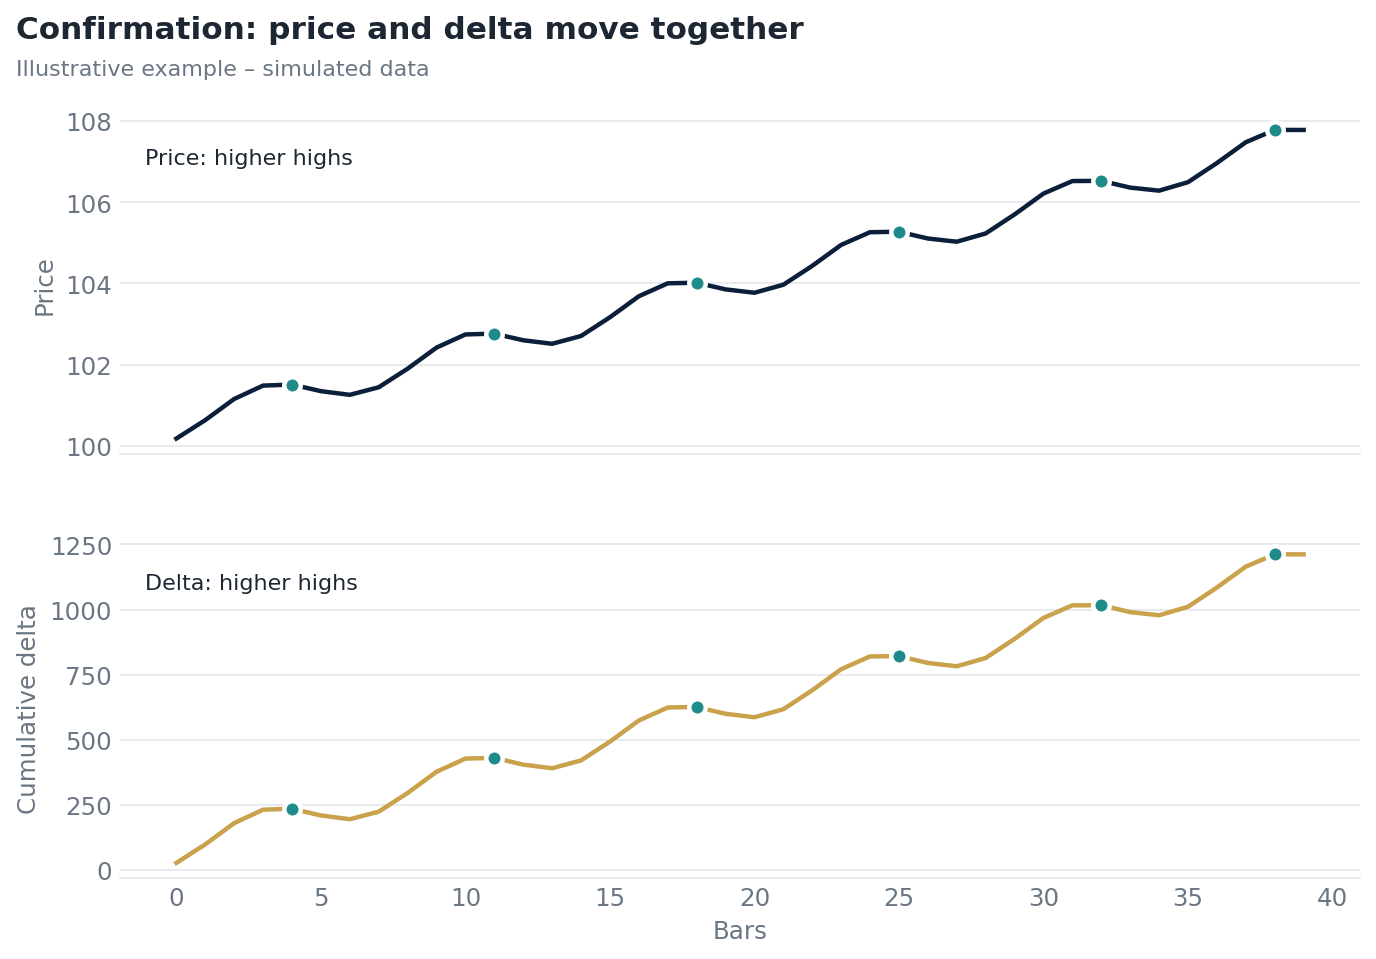
Illustrative example on simulated data: every higher high in price is matched by a higher high in delta.
This is the simplest case. The move has fuel, because aggressive buyers are genuinely driving it.
There’s no reason to fade a move like this just because “it’s already gone up a lot”.
2. Divergence
Price makes a new high. Cumulative delta doesn’t.
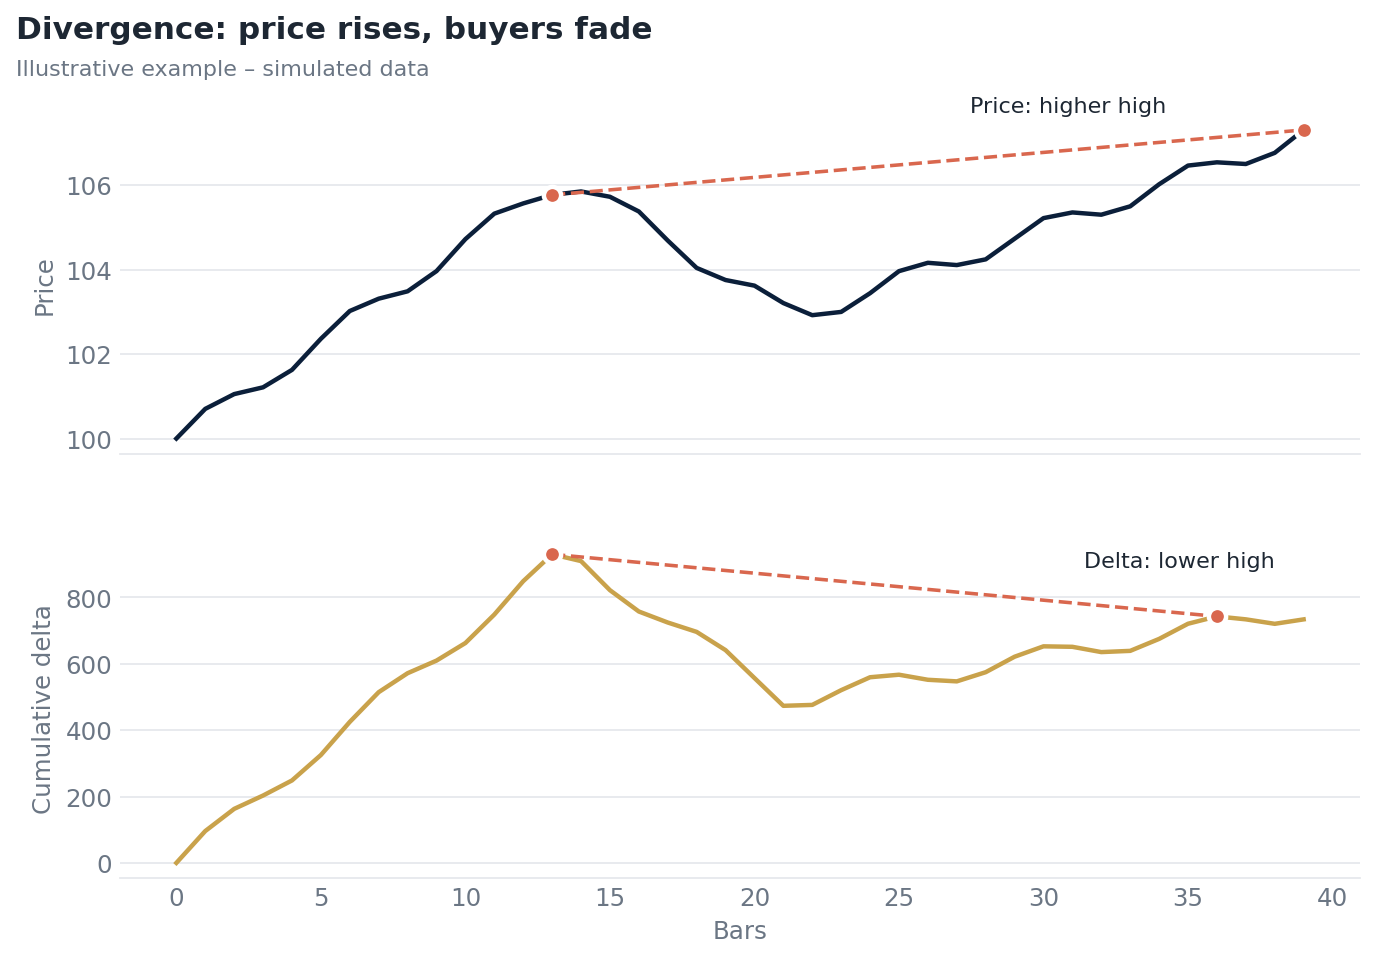
Illustrative example on simulated data: price breaks higher, while delta stalls below its previous high.
What does it mean? The move up continues, but fewer and fewer buyers are willing to pay for it.
Price may be rising on a lack of supply rather than strong demand. A move like that breaks easily.
Divergence is not an entry signal on its own. It’s a warning. It tells you to tighten protection on your position or hold off on new buying.
3. Absorption
Delta is heavily negative. Sellers attack bar after bar. And price… doesn’t move.
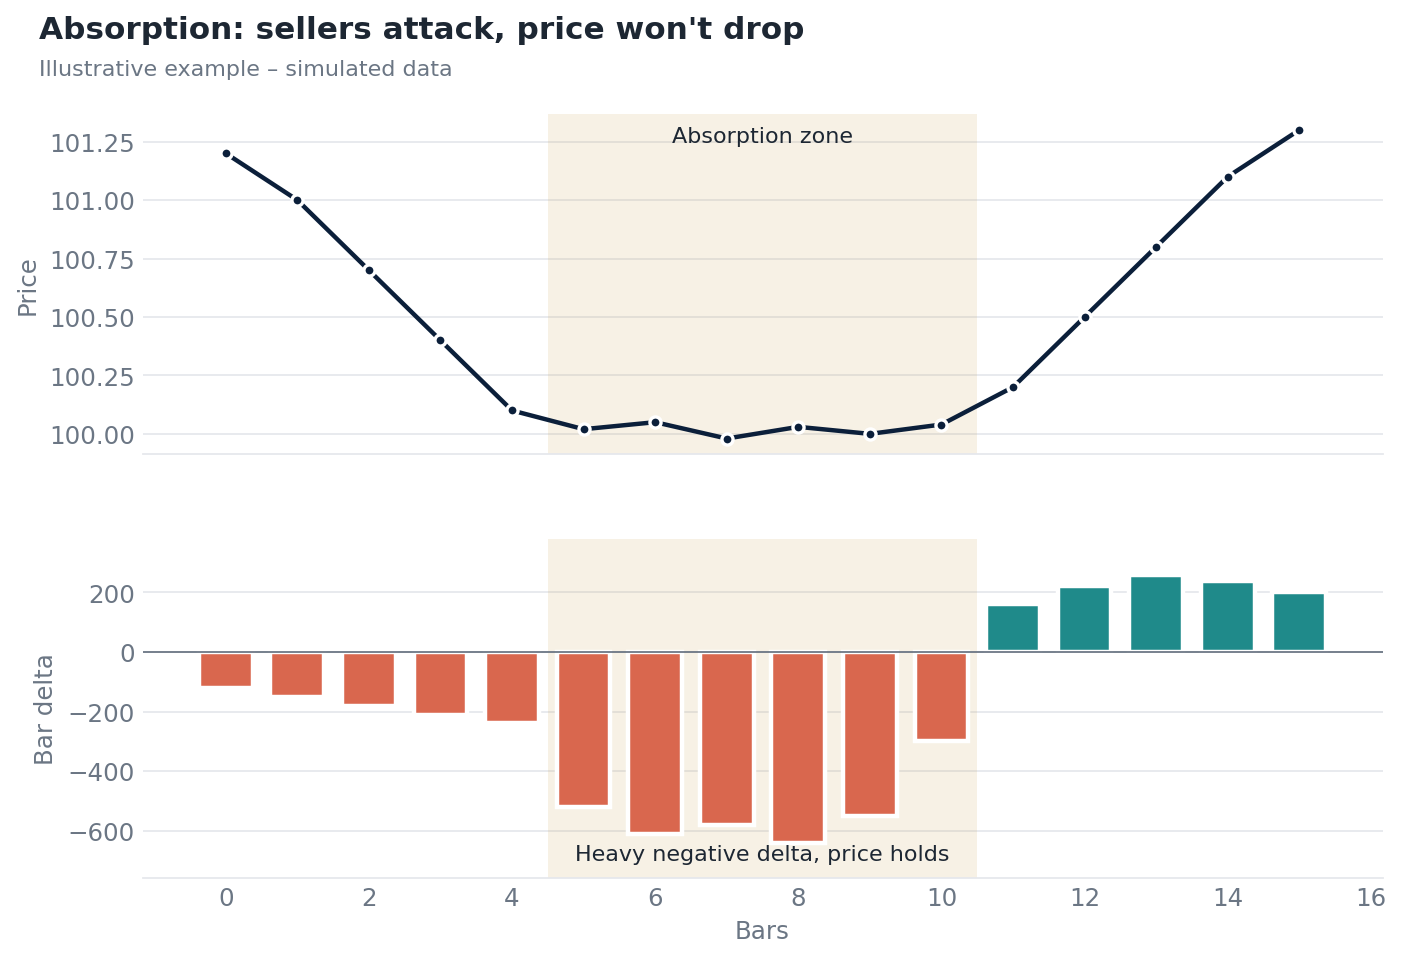
Illustrative example on simulated data: sellers attack, but price won’t drop. Once supply is exhausted, the market bounces.
It means someone on the other side is passively taking in all that selling. Most often it’s a large player with buy limits, building a position.
Absorption is one of the most valuable signals in order flow. It often precedes a reversal. Once the aggressive side is exhausted, a small push is enough to send the market the other way.
It works the other way too. Heavy positive delta without a rise in price means someone is selling into those purchases.
What it looks like in Delta Analyzer®
Calculating delta by hand is impossible. That’s why we built Delta Analyzer®.
The tool shows, in one place:
- delta and its accumulation in real time,
- delta at price levels, so you can see exactly where the battle took place,
- session summaries, so you can quickly judge who won the day,
- key zones, absorption and initiative.
There are two versions: Intraday for analyzing the whole session and Scalping for short, fast decisions.
Delta Analyzer® currently covers more than 40 instruments: indices, currencies, commodities and crypto.
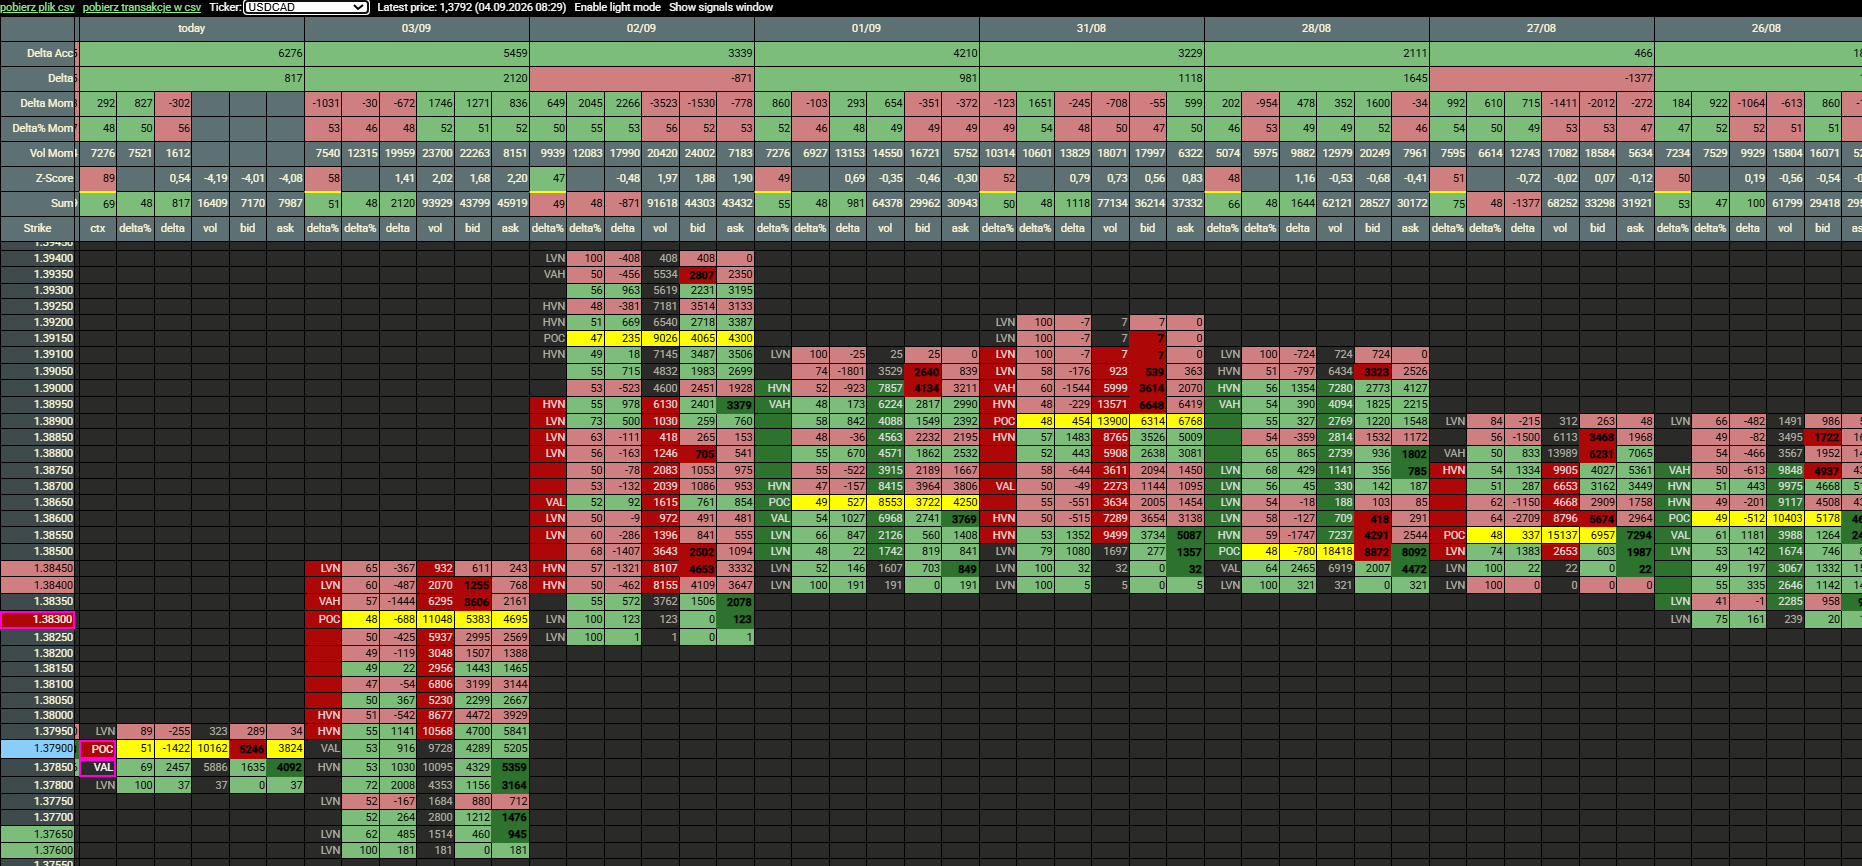
Delta Analyzer® dashboard: delta and its accumulation during the session.
What delta won’t tell you
We promised honesty, so here are the limitations.
Delta is not a signal on its own. A divergence can last a long time while price keeps rising. Absorption can break.
Context matters more than the reading. The same delta means one thing in the middle of the day’s range and another at the edge of the value area. That’s why we combine it with Volume Profile.
Data quality matters. In markets without a central exchange, such as spot forex, volume data comes from a specific source, not the whole market. Keep that in mind when interpreting it.
Large orders can hide. Algorithms split them into hundreds of small trades. Delta shows the effect, but not always the intent.
Delta is a magnifying glass, not a crystal ball. It shows what’s happening beneath the surface of price. The decision is still yours.
What’s next?
In upcoming posts we’ll break down each of these situations:
- how to tell real absorption from a brief pause in the move,
- how to combine delta with Volume Profile and value levels,
- what these patterns look like in real sessions in Delta Analyzer®.
Have a question about delta? Write to tomek@ttechou.com or on X: @TomaszPacz42169.
Tomasz Paczóski
Content published on this blog is for educational purposes only and does not constitute investment advice. Trading derivatives carries a high risk of losing capital.