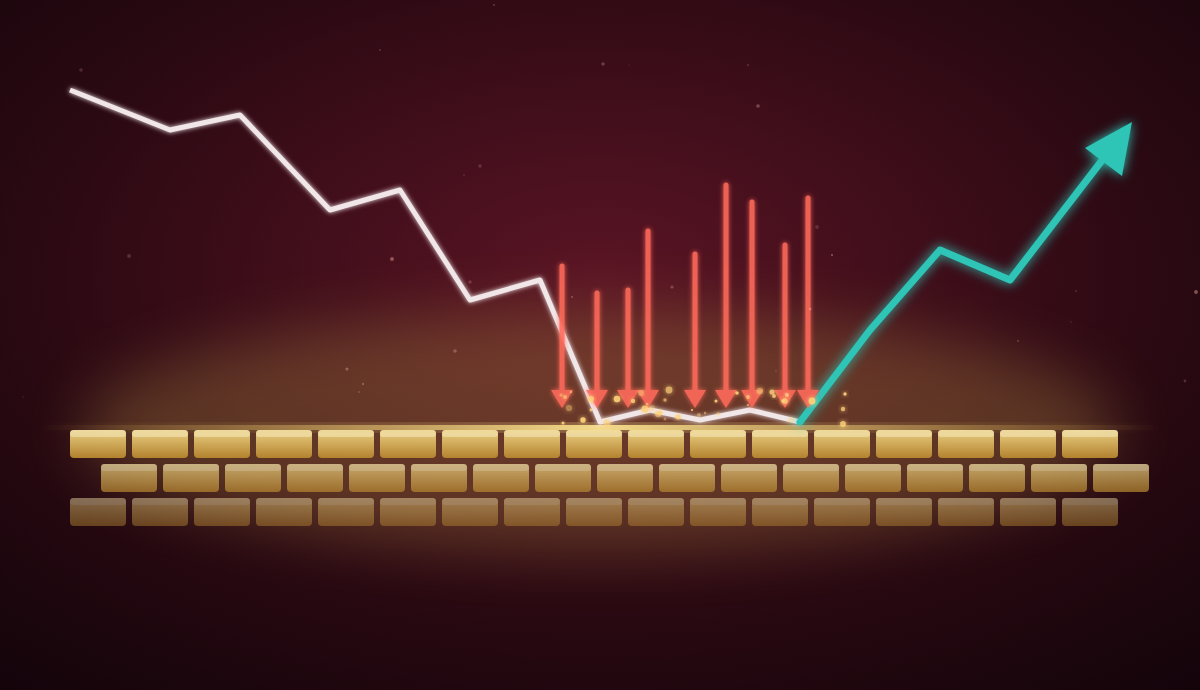
Price falls and stops at support.
For several bars it doesn’t move. On a price chart this always looks the same: a flat stretch.
Underneath, two completely different things can be happening:
- absorption: someone large is taking in all the selling and defending the level,
- a temporary pause: the market is simply catching its breath before falling further.
The first often signals a reversal. The second is trend continuation. Confusing them is expensive.
In our previous post, “Delta from scratch”, we showed what absorption is. Today we look at how to recognize it and not get fooled.
The principle: effort versus result
The whole topic comes down to one question:
How much effort did the aggressive side put in, and what was the result?
Absorption is big effort with no result. Sellers attack hard, but price won’t drop. Their energy hits a wall of passive orders.
A pause is no effort and no result. Nobody is attacking, so price has no reason to move.
Both give you a flat price. They differ in what happens in delta and volume.
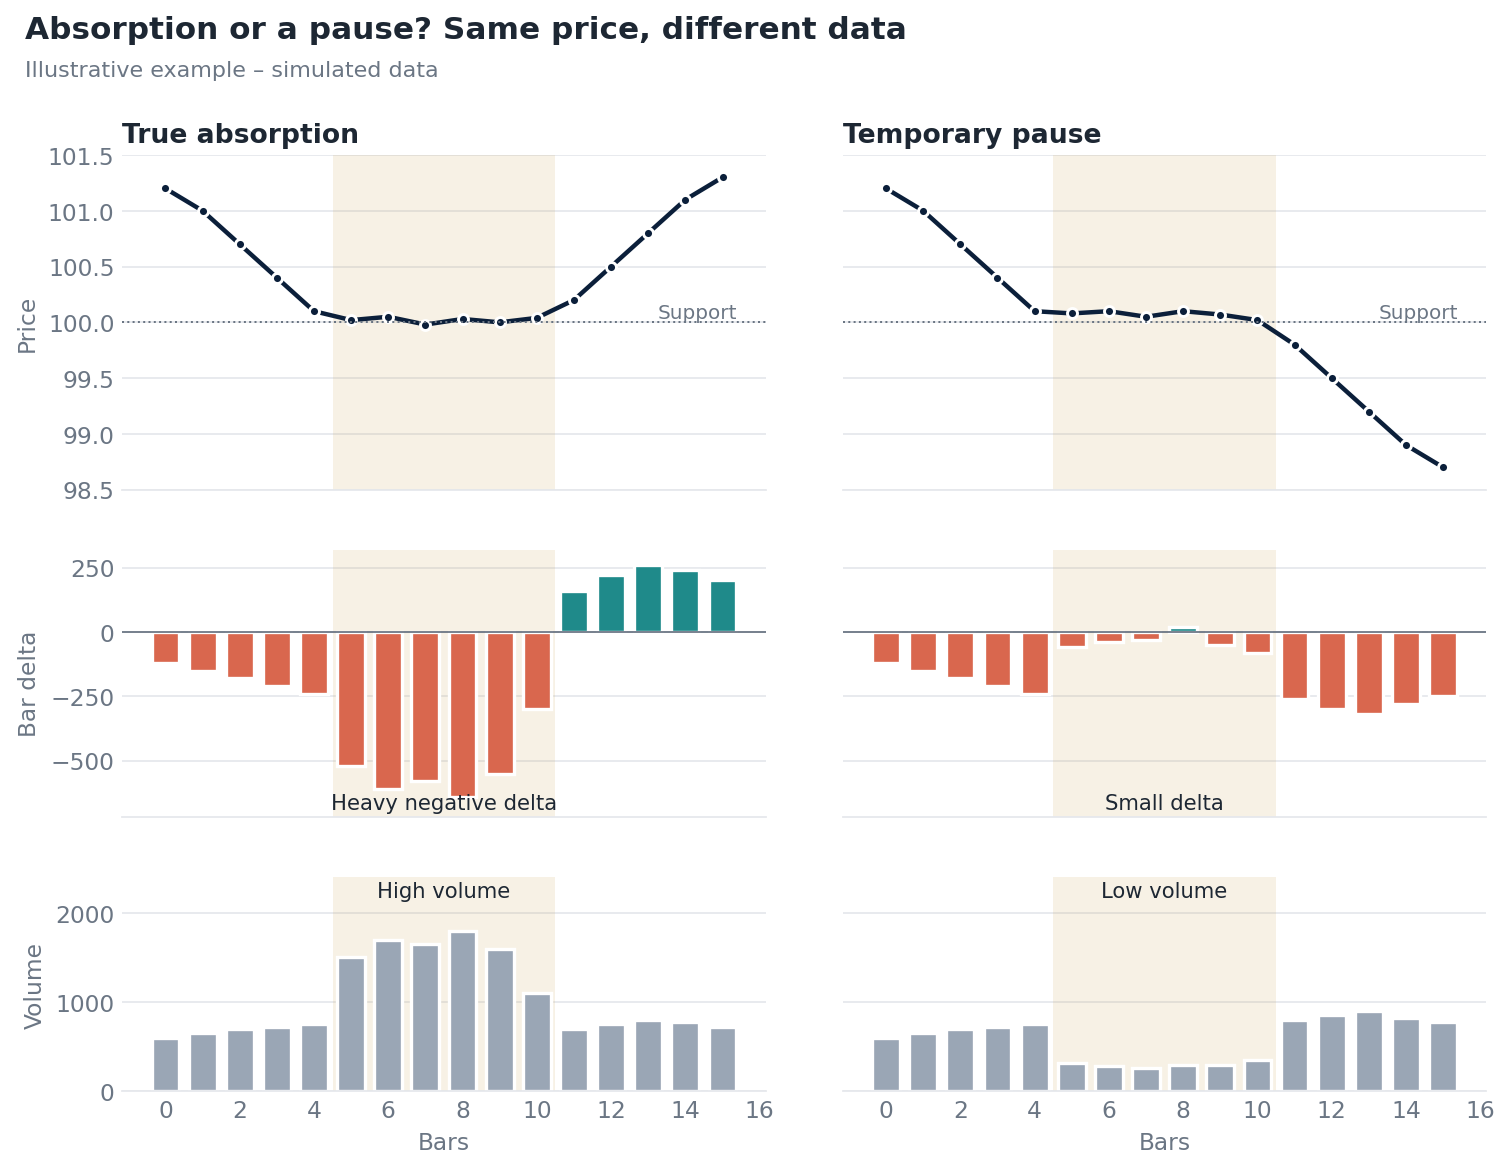
Illustrative example on simulated data. Left, absorption: heavy negative delta, high volume, then a bounce. Right, a pause: small delta, low volume, then the decline continues.
Five tests worth running
1. How big is the delta?
In absorption, delta is clearly larger than usual. Sellers don’t let up, bar after bar.
In a pause, delta shrinks and hovers around zero. Both sides are waiting.
Compare delta with typical values from recent bars, not with an absolute number. “Large delta” means something different on every instrument and at every time of day. A good starting point is to ask whether delta in the test zone is at least twice the typical delta of the preceding bars.
2. What is the volume?
Absorption means high volume. Many contracts change hands, yet price stays put.
A pause means low volume. The market goes quiet.
This is the simplest filter. A flat price on falling volume is almost never absorption.
3. Where is it happening?
Absorption makes sense at a level worth defending:
- the edge of the value area (VAL or VAH),
- the previous session’s POC,
- a high-volume node (HVN),
- the previous day’s low or high.
A large player doesn’t defend a random price in the middle of the range. If “absorption” shows up at a level that means nothing, treat it with caution.
4. How is delta distributed across price levels?
In absorption, aggressive selling concentrates on one or two levels. That’s where the wall of buy orders stands, and that’s where every attack ends.
In a pause, trades are small and scattered. There’s no level where a battle is taking place.
That’s exactly what the delta-at-price view in Delta Analyzer® is for. It shows precisely at which price sellers hit and where they were stopped.
5. What happens next?
This is the most important test, and the only one that gives certainty, though only after the fact.
After absorption, the aggressive side runs out of steam. Delta flips sign, price moves away from the level, and sellers don’t come back with the same force.
After a pause, volume returns and so does the same direction. Delta builds again on the side that dominated before, and price continues its move.
That’s why it doesn’t pay to enter during a suspected absorption. It’s better to wait for the first sign of a reaction: delta flipping sign and price moving away from the level.
Cheat sheet
| Feature | Absorption | Temporary pause |
|---|---|---|
| Delta | large, clearly above normal | small, around zero |
| Volume | high | low |
| Location | key level (VAL/VAH, POC, HVN, day’s extreme) | anywhere |
| Delta at price levels | concentrated on 1–2 levels | scattered |
| What comes next | delta flips, price leaves the level | volume and the prior direction return |
The trap: absorption that breaks
To be honest, we need to add one thing. Absorption doesn’t always win.
The passive buyer has limited capital or a predetermined limit. Once it’s used up, or the orders are pulled, the wall disappears.
Then all the accumulated selling pressure goes through the level at once. Stop orders from people who bought “on the absorption” get triggered. The move down is often faster and stronger than before the test.
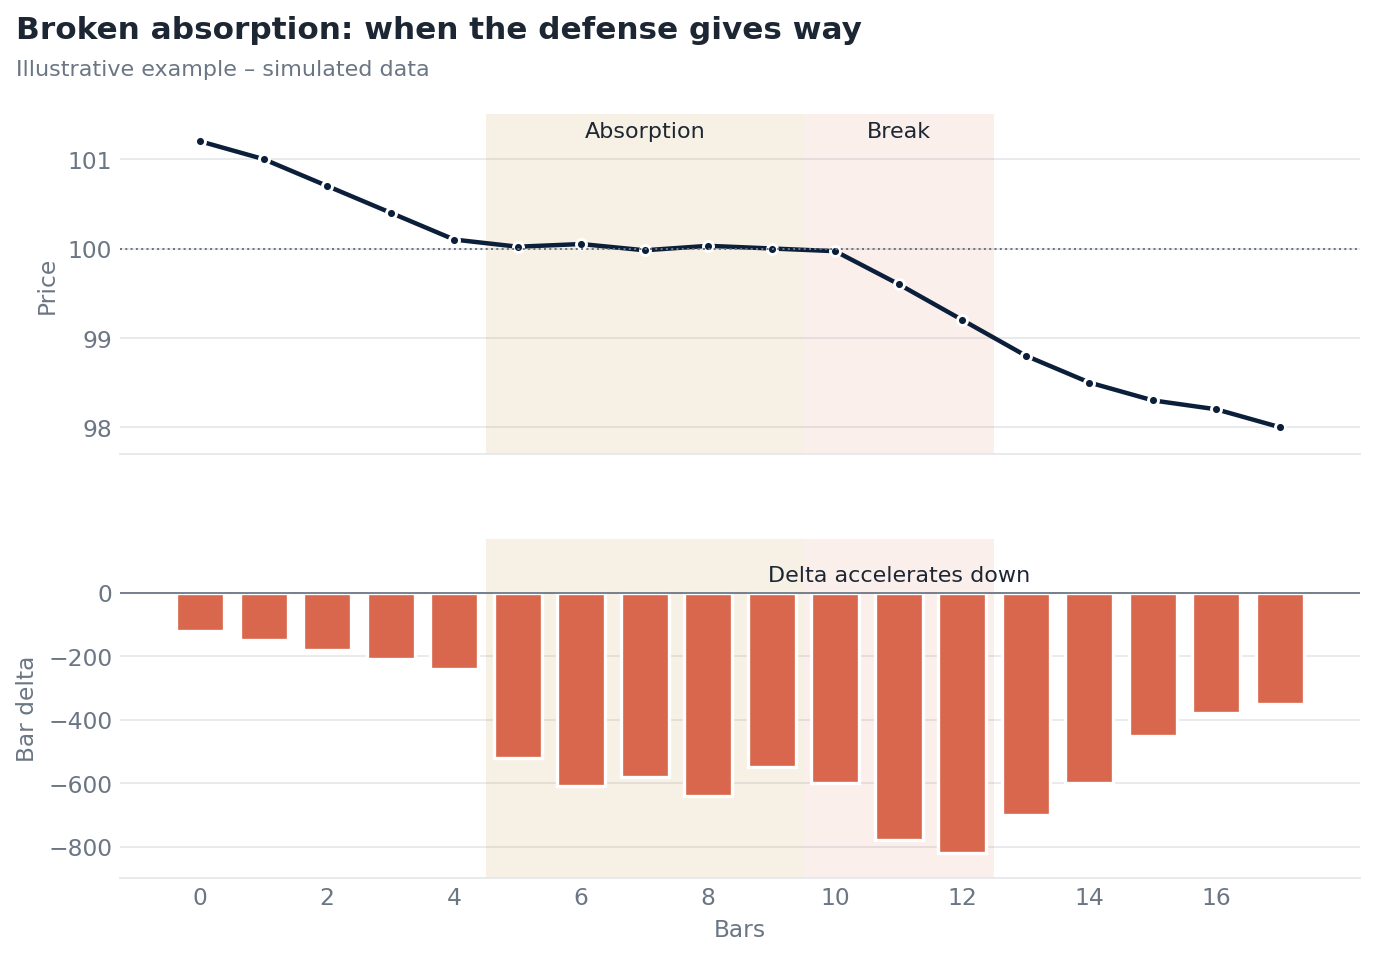
Illustrative example on simulated data: after several bars of defense, support breaks and negative delta accelerates.
Warning signs:
- delta doesn’t fade, even as price stalls for longer and longer,
- price starts printing new lows by one or two ticks, meaning the wall is moving,
- volume at the defended level keeps rising with no price reaction for many bars in a row.
Absorption does have one big advantage: it gives you a precise invalidation point. If price closes decisively beyond the defended zone, the scenario is off. The stop-loss has a natural place just beyond that zone.
What it looks like in Delta Analyzer®
All five tests can be run in one tool:
- bar delta and cumulative delta: tests 1 and 5,
- volume: test 2,
- key zones: test 3,
- delta at price levels: test 4.
Delta Analyzer® covers more than 40 instruments: indices, currencies, commodities and crypto. The Intraday version shows absorption at the day’s levels best. The Scalping version shows short tests on lower timeframes.
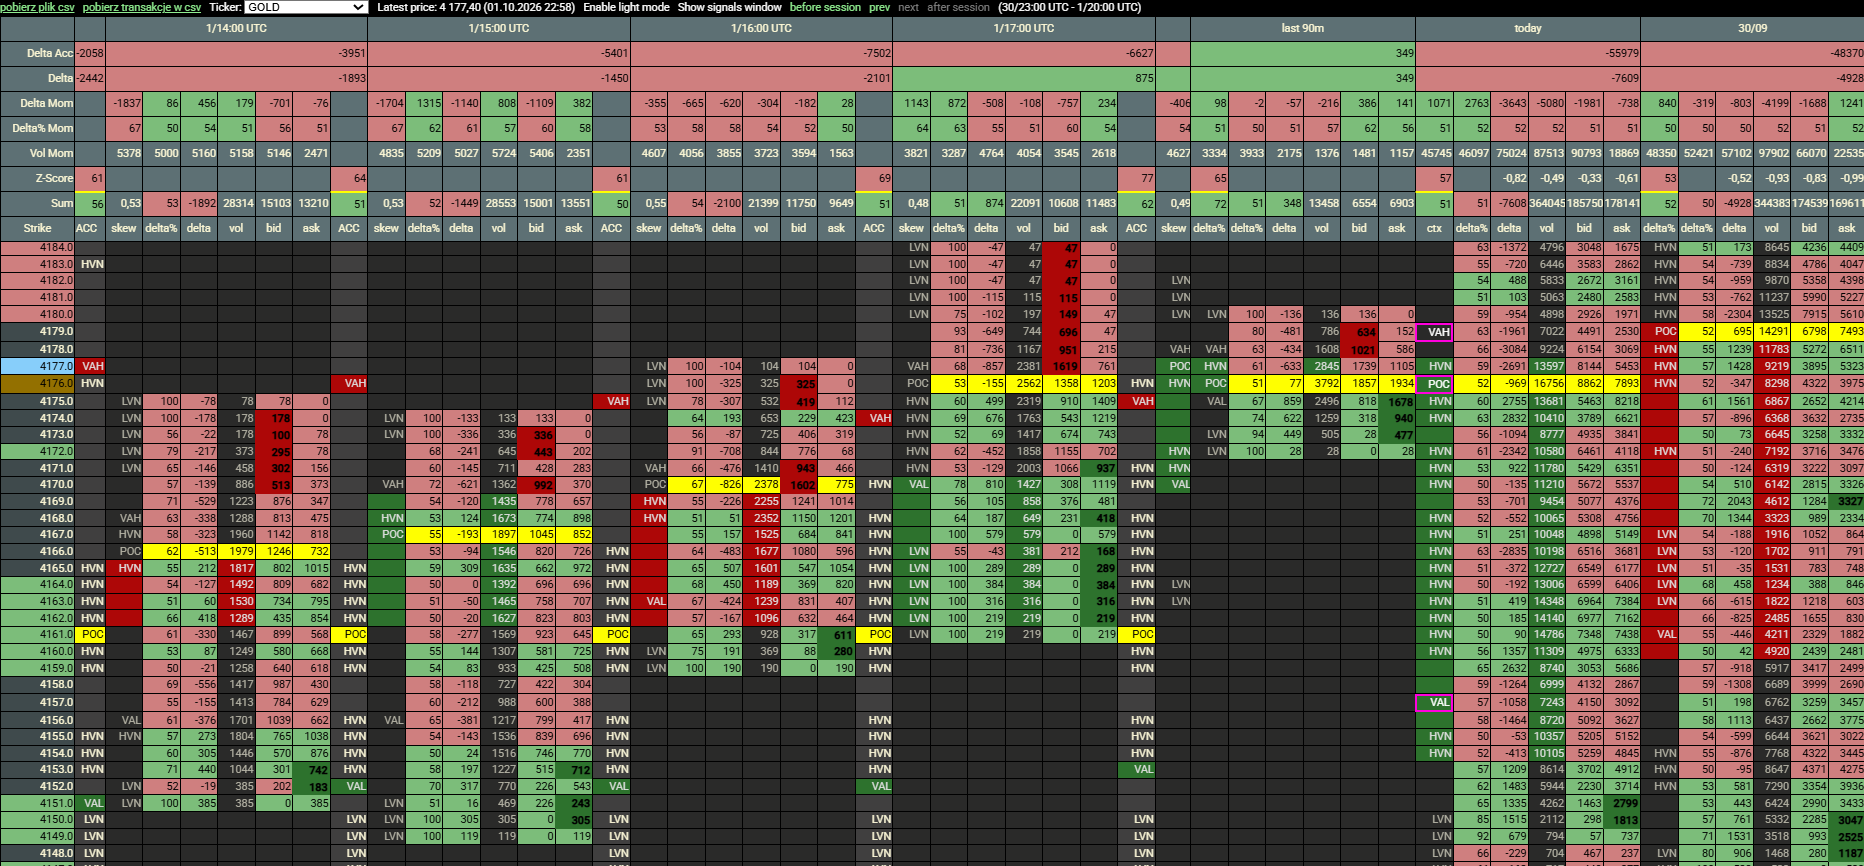
Delta Analyzer®: delta at price levels in an absorption zone.
Summary
A flat price is only half the information. Delta and volume give you the other half.
- Big effort with no result at an important level is an absorption candidate.
- No effort and no result is a pause.
- Final confirmation only comes with the price reaction.
Don’t guess. Wait for the market to show who won.
What’s next?
In the next post we’ll combine delta with Volume Profile. We’ll show why the same absorption at the edge of the value area means far more than in its middle.
Have a question, or your own example of absorption? Write to tomek@ttechou.com or on X: @TomaszPacz42169.
Tomasz Paczóski
Content published on this blog is for educational purposes only and does not constitute investment advice. Trading derivatives carries a high risk of losing capital.