In our previous post we learned to tell absorption from a temporary pause.
One of the five tests was: where is it happening?
Today we expand on that test. The same absorption, with identical delta and identical volume, can mean a great deal or almost nothing. It all depends on location.
Volume Profile defines that location.
Volume Profile in 60 seconds
Regular volume shows when trading happened. Volume Profile shows at what price it happened.
We plot volume horizontally, next to each price level. The result is a profile that shows where the market spent the most time and money.
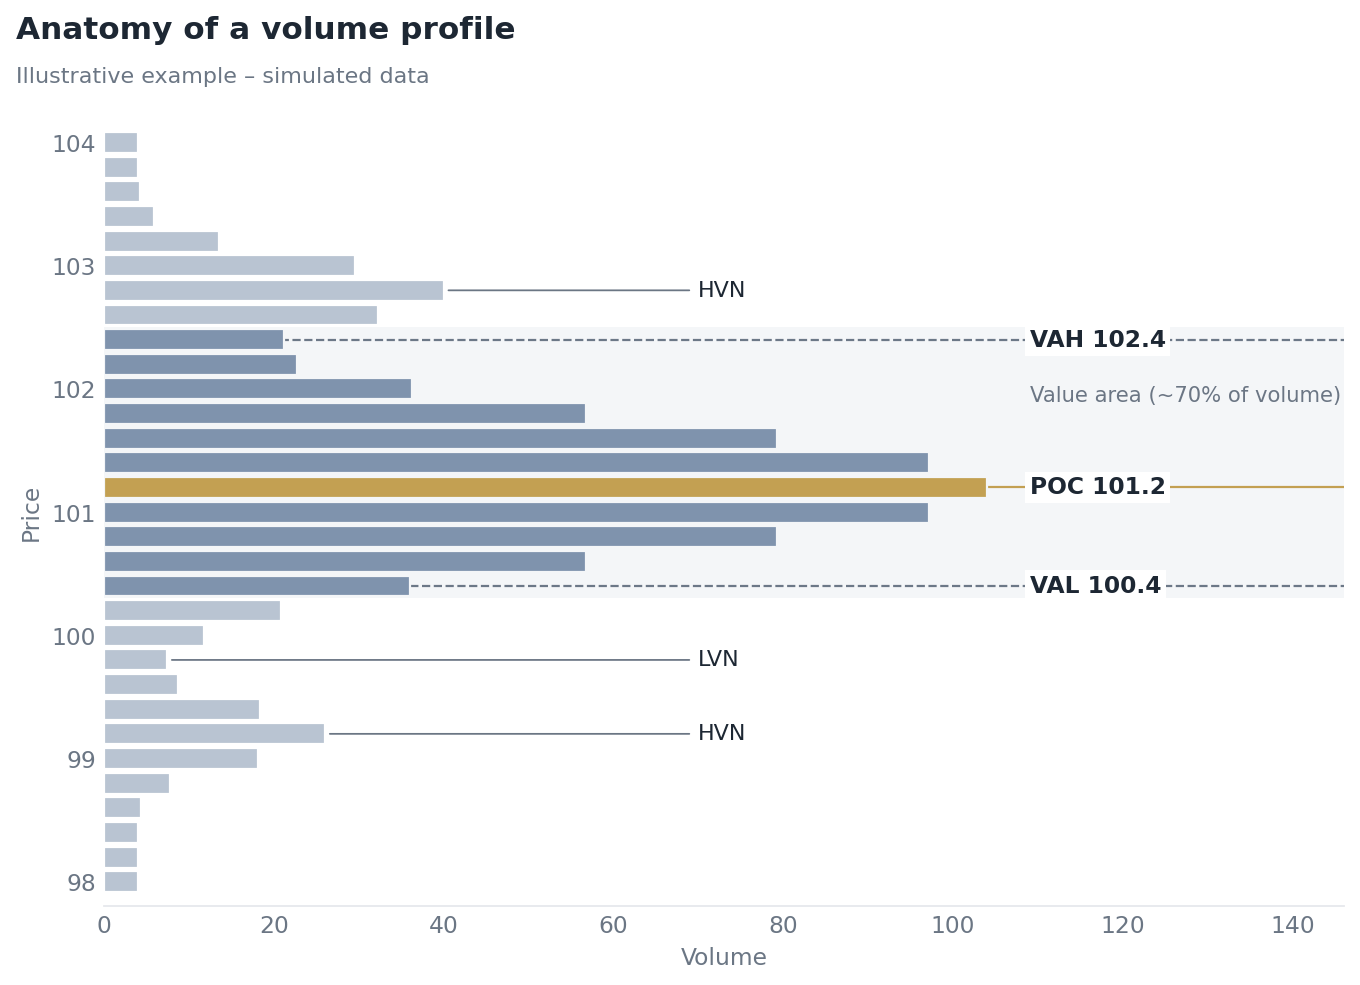
Illustrative example on simulated data.
A few terms we’ll need:
- POC (Point of Control): the level with the highest volume. The price the market considered most “fair”.
- Value Area: the range where about 70% of the volume traded. It’s the zone the market accepted.
- VAH and VAL: the upper and lower edges of the value area.
- HVN (High Volume Node): a local zone of acceptance, where price tends to slow down.
- LVN (Low Volume Node): a zone of rejection, where price usually moves through quickly.
The market as an auction
The simplest way to think about the market is as an auction searching for a price both sides accept.
Inside the value area, price is “fair”. Buyers and sellers are both comfortable. Trade flows both ways and nobody has a clear edge.
At the edge of the value area, the market has to make a decision. Price is now “cheap” or “expensive” compared with what was accepted before.
There are only two outcomes:
- rejection: price returns to value, most often toward the POC,
- acceptance: the market starts trading outside value and builds a new area.
The edges are where this gets decided. That’s why delta tells you the most there.
The same absorption in two places
Let’s look at two situations with identical delta. Sellers attack for five bars, and price doesn’t move.
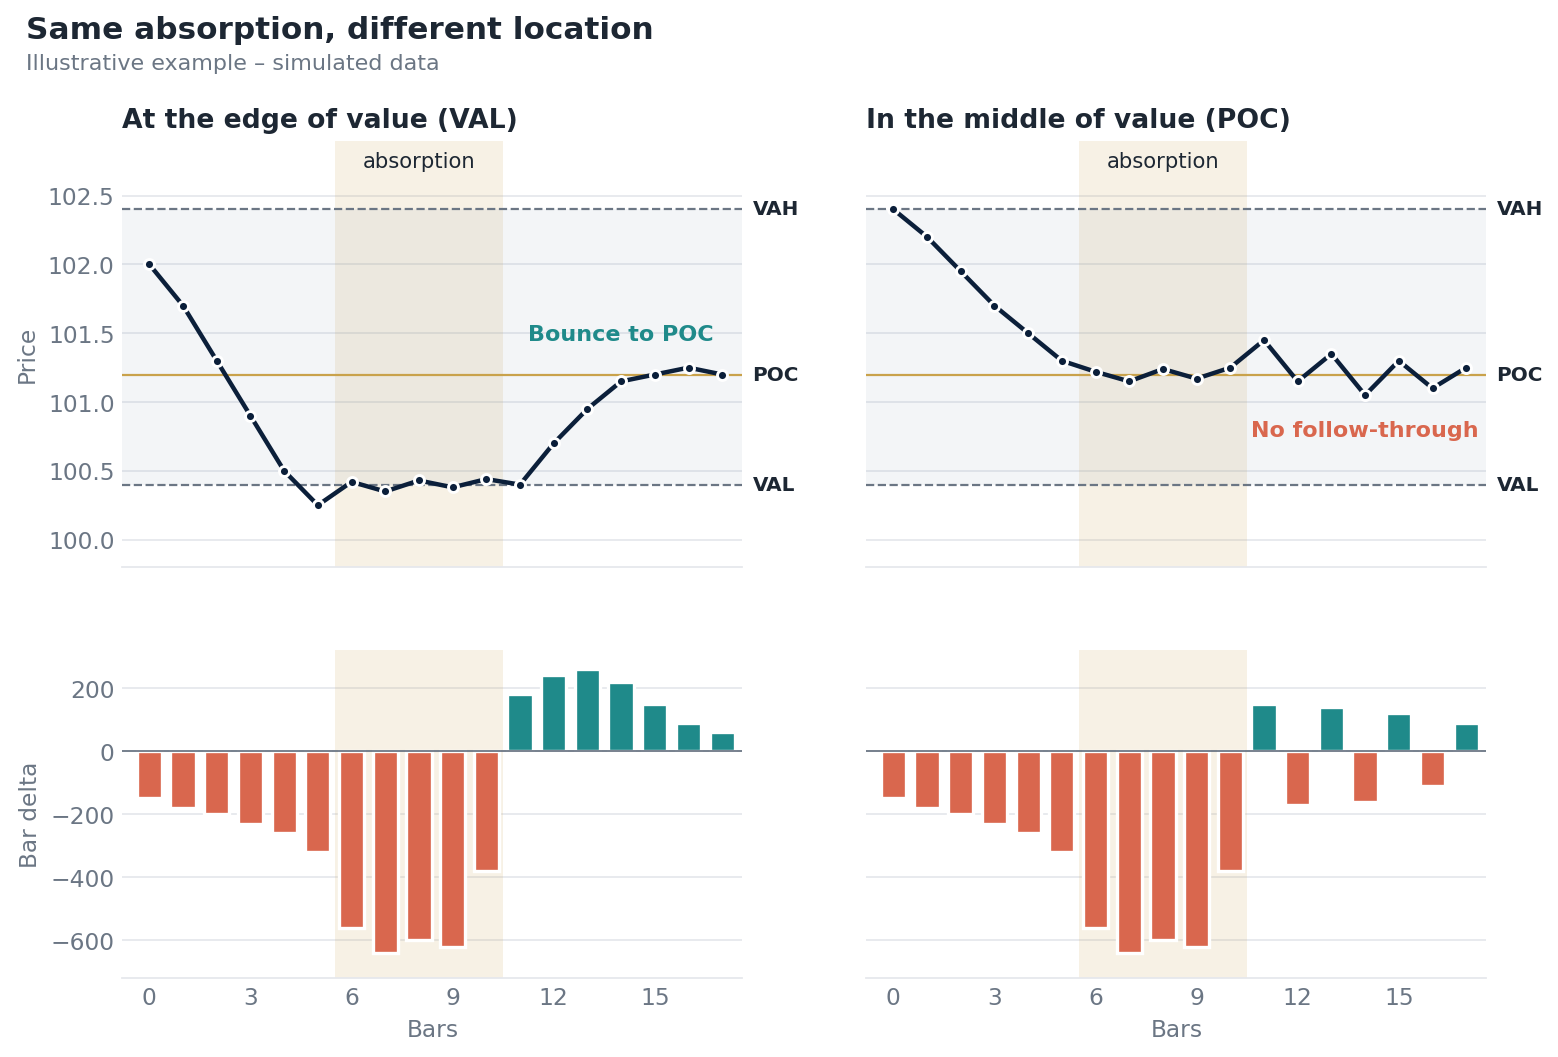
Illustrative example on simulated data. Left: absorption at VAL and a bounce to POC. Right: identical delta at POC and no follow-through.
At the edge of value (VAL)
Price falls to the lower edge of value. Sellers try to push it lower, into territory the market hasn’t accepted before.
Someone takes in all that selling. It’s usually responsive buyers reacting to a low price. For them VAL is an opportunity, because below value is “cheap”.
Once sellers run out of steam, the market has an obvious target: back to value, toward the POC.
Absorption at VAL is a rejection signal. It has logic, a direction and a target.
In the middle of value (POC)
Now the same delta at the POC.
Here nobody needs to defend anything. The POC is the price where both sides are happy to trade. Heavy selling at the POC often gets absorbed simply because it’s the most liquid spot on the chart.
After that kind of “absorption”, price usually rotates around the POC. No bounce, no continuation, just noise.
Absorption at the POC is information about liquidity, not about direction.
Why the edge gives you a better trade
The difference isn’t just about probability. It’s also about how the position is built.
At the edge of value, everything has a natural place:
- entry: after the reaction to the absorption, near VAL,
- stop-loss: just below the absorption zone. If price closes there, the market has accepted lower prices and the scenario is off,
- first target: the POC,
- second target: the opposite edge of value (VAH).
In our example: entry at 100.5, stop at 100.1, so 0.4 of risk. The POC (101.2) is 0.7 away, and VAH (102.4) is 1.9 away. Even the first target gives a reward-to-risk better than 1:1.
In the middle of value, that logic is missing. There’s no obvious place for a stop, because price oscillates around the POC anyway. A tight stop gets taken out by ordinary noise, and a wide one ruins the reward-to-risk. The target is unclear too: up or down?
Cheat sheet: location plus delta
| Location | What delta shows | Interpretation |
|---|---|---|
| VAL | absorption of selling | possible rejection, return toward POC |
| VAL | aggressive selling and price moves lower | acceptance below value, move to the next HVN |
| VAH | absorption of buying | possible rejection, return toward POC |
| VAH | aggressive buying and price moves higher | acceptance above value, breakout |
| POC / middle of value | anything | mostly noise, better to wait |
| LVN | absorption | rare and suspicious, price usually moves through quickly |
The same delta, six different meanings. That’s why we always read delta in the context of the profile.
A four-step procedure
- Mark the levels before the session. VAH, VAL and POC from the previous session. Add HVNs and LVNs from a profile of the last few days.
- Wait for the edge. Don’t look for signals in the middle of value. Let price come to VAH or VAL.
- Read delta at the edge. Absorption points to possible rejection. Initiative, meaning aggressive delta with price following, points to possible acceptance.
- Wait for the reaction. Enter after delta flips sign and price moves away from the level. Stop beyond the zone, target the POC.
What Volume Profile won’t tell you
Limitations, as always.
The value area is a convention. The 70% threshold is a convention, not a law of nature. Different platforms calculate it slightly differently, so levels can differ by a few ticks.
Data matters. A profile built from a single data source, for example in forex, shows part of the market, not all of it.
The chosen period changes the picture. A single-session profile and a five-day profile can point to different levels. The strongest spots are where both line up.
News breaks the profile. When major macro data is released, the market can jump right over the value area with no auction at all.
What it looks like in Delta Analyzer®
In Delta Analyzer® you see the volume profile and delta together:
- key zones from the profile: value area, POC, volume nodes,
- delta at price levels, showing exactly at which price the battle took place,
- bar delta and cumulative delta, showing the reaction after a level is tested.
It works across more than 40 instruments: indices, currencies, commodities and crypto.
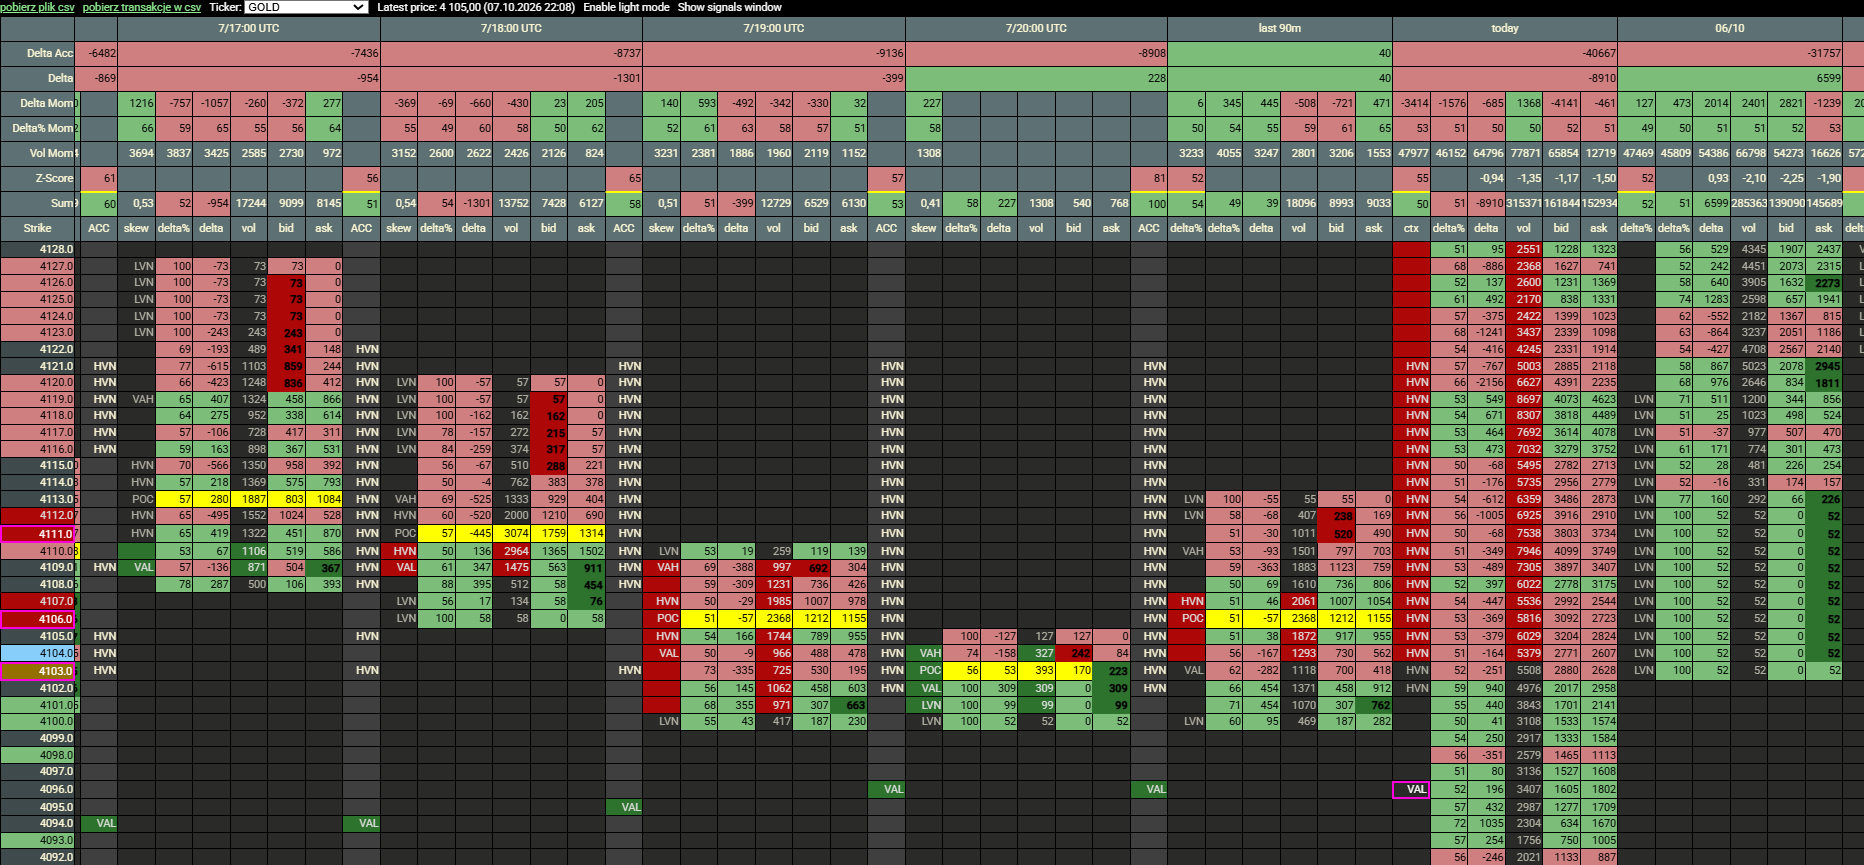
Delta Analyzer®: volume profile and delta at the edge of the value area.
Summary
- Delta tells you what aggressive players are doing.
- Volume Profile tells you where it matters.
- The best signals appear where the market has to make a decision: at the edges of value.
- The middle of value is a noise zone. There, the best decision is often no decision.
Combining delta with volume profile is one of the main themes of the book we’re writing with Michał Babiński, Order Flow i Volume Profile (Order Flow and Volume Profile). We’ll be sharing more excerpts from it on the blog.
What’s next?
In the next post we’ll move from illustrative examples to the live market. We’ll show what these patterns look like in real sessions in Delta Analyzer®.
Have a question, or your own example? Write to tomek@ttechou.com or on X: @TomaszPacz42169.
Tomasz Paczóski
Content published on this blog is for educational purposes only and does not constitute investment advice. Trading derivatives carries a high risk of losing capital.