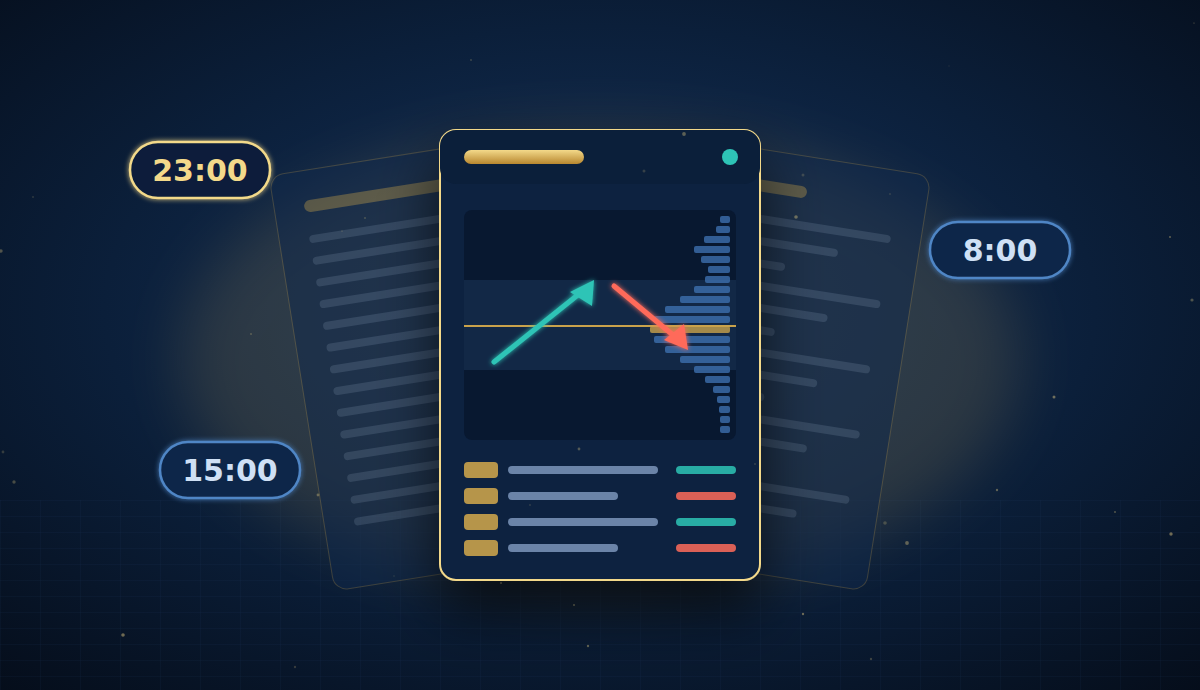
In the very first post on this blog, we promised to publish a daily market report based on our own data.
That moment has arrived.
In this post we explain what our reports are, when they come out, what’s in them, and what you won’t find there.
Why a report?
Over the last few posts we’ve built a shared vocabulary: delta, absorption, Volume Profile, value area.
The report is where that vocabulary turns into something concrete. Instead of a vague “the market looks strong”, you get:
- levels that matter for the next session,
- scenarios with an exact entry, stop and target,
- a settlement, showing how the previous scenarios held up against the market.
Every scenario comes from the same rules: a decision table that combines where price sits relative to value with how delta behaves. No gut feeling, no “I think”.
One report a day, in the evening
We’re starting with one report a day for US500 and GOLD.
The report comes out in the evening, after the session closes. It contains a full analysis for the next session: levels, scenarios, the map and context. Plus the settlement of the day that’s ending.
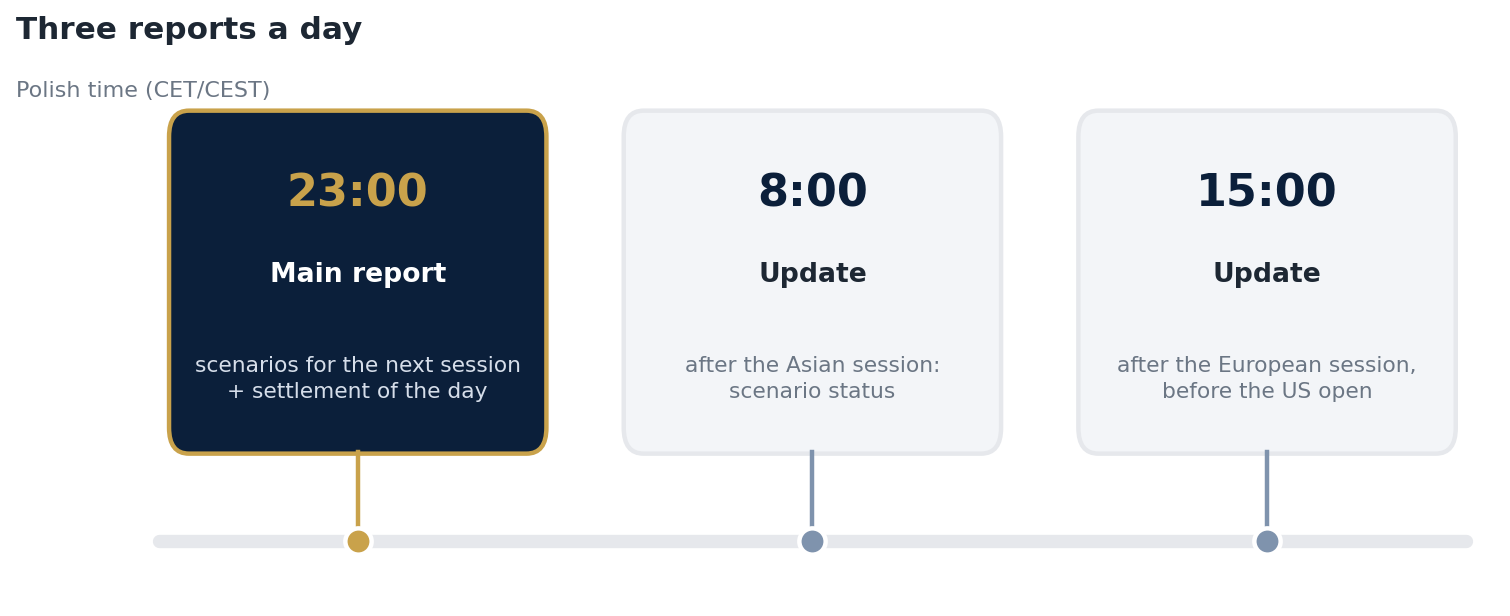
Target publishing schedule. The 8:00 and 15:00 updates (Polish time) will be added once the reports are generated automatically.
Eventually the evening report will be joined by two intraday updates: after the Asian session, and after the European session before the US open. They’ll show the status of each scenario: armed, waiting, or already played out. We’ll also add more instruments gradually.
What’s in the main report
1. Decision table status
The first page tells you straight away whether the market has given a signal. It shows either a setup code or the message “no code – observation”.
That second message shows up more often than you might expect. And that’s a good thing. No signal is information too: today the market offers no edge.
Next to it are the reference levels:
- VAH, VAL and POC from the previous session,
- the value area of the last five sessions (5D),
- high and low volume nodes (HVN and LVN) from the 5D profile,
- the five-session high and low.
2. Scenario table
The heart of the report. Each scenario has:
- a setup code, e.g. Y1, K2 or P1,
- an activation condition: what has to happen for the scenario to kick in,
- entry, stop-loss and targets (TP1, TP2),
- reward-to-risk (RR),
- a status: valid or rejected.
We show rejected scenarios too. If the target is too close and the RR too low, we say plainly that the setup doesn’t qualify, and why.
3. Scenario map
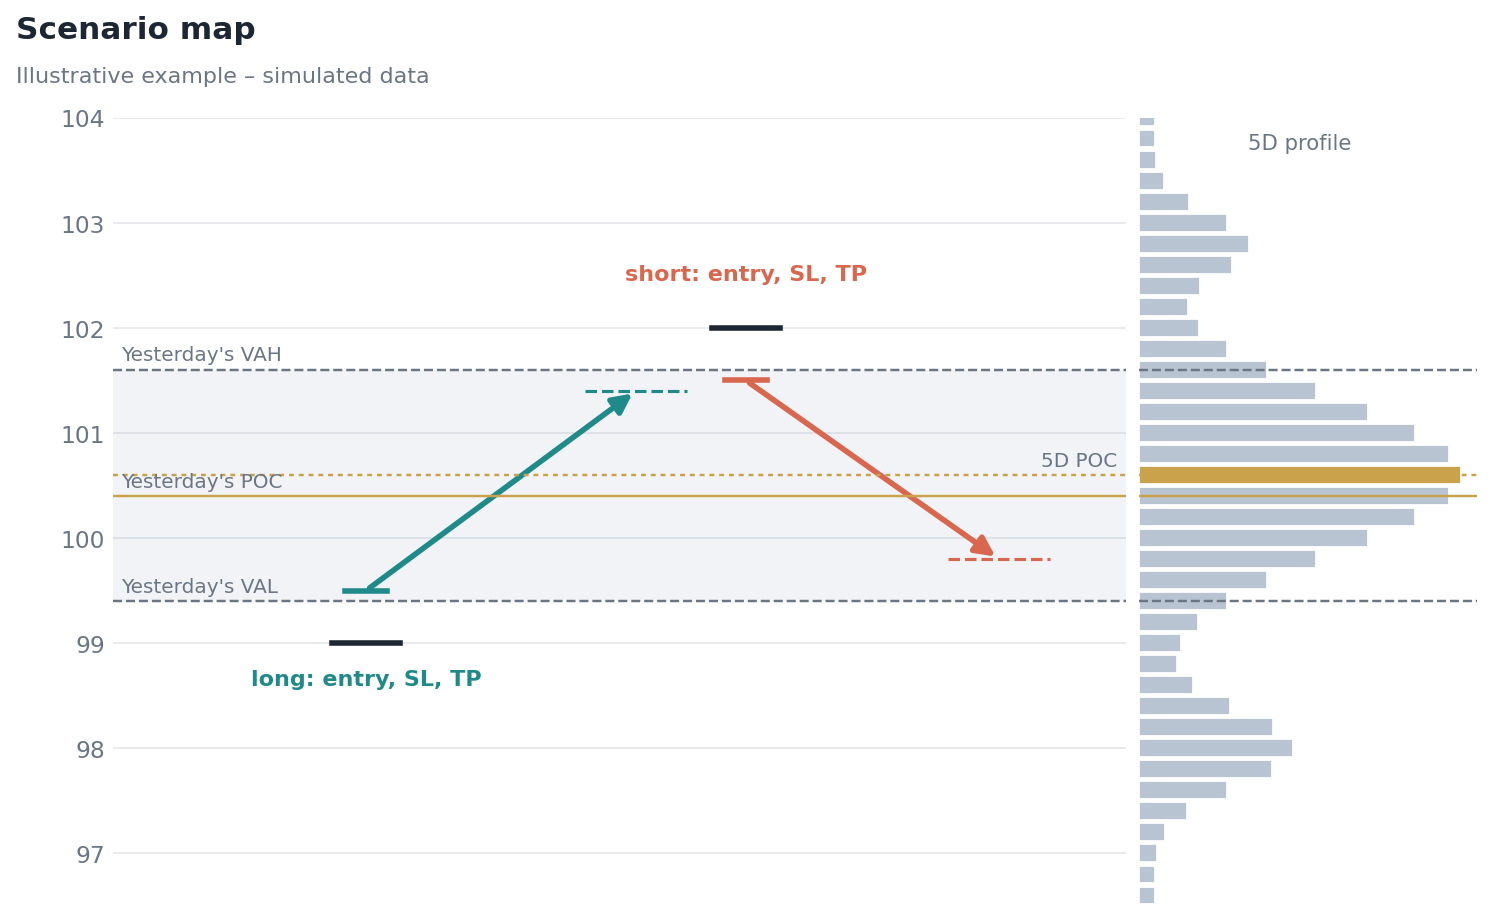
Illustrative example on simulated data.
All scenarios on one chart, against the volume profile. Green arrows are long, red ones are short, black ticks are stops, and dashed lines are targets.
One look is enough to see where the market may react, and in which direction.
4. Context
Profiles of the last five sessions and the composite profile, with delta at price levels underneath. You can see where buyers and sellers fought hardest and which side was winning.
5. The last session
Hour by hour: range, hourly POC, delta and cumulative delta. This shows how the market got to where it is today.
The setups in the report
Each scenario carries a code that maps to a specific setup in the decision table. The letter is the type of situation, and the digit is the direction: 1 is long, 2 is short.
| Code | Setup |
|---|---|
| K | continuation |
| R | retest of new value |
| S | breakout within old value |
| N | failed breakout |
| P | return to POC |
| X | absorption |
| G | opening gap |
| Y | breakout from yesterday’s value |
We cover each one on the blog in a separate post, with full rules. The first was setup Y.
Settlement: our most important rule
Every main report starts with the settlement of the previous day.
Which scenarios were triggered? Which hit their target and which hit their stop? How many R did the day bring?
We settle everything, including losing days and scenarios that didn’t work out. Without that, the report would be just another forecast nobody checks.
After a few months of settlements we’ll have what matters most in trading: an honest track record from live markets, not just a backtest.
What you won’t find in the report
Buy or sell instructions. The report is market analysis. We show levels and scenarios, but the decision to trade, how big and with how much risk, is yours alone.
Percentage odds of direction. It’s tempting to write “70% chance of a rise”. We won’t, until we’ve collected a long enough history to justify it.
Certainty. Some scenarios won’t work. That’s true of any system built on probability. What counts is the result over many trades, not a single day.
Where to find the reports
We publish the reports on our Discord. They’ll be on the website soon too.
If you’d like to understand where the levels and signals come from first, start with our earlier posts:
- Delta from scratch,
- Absorption or a temporary pause?,
- Delta and Volume Profile,
- Setup Y: breakout from yesterday’s value.
What’s next?
In upcoming posts in the series we cover the remaining setups from the report. Each one with full rules, an example and results.
Have a question about the report, or a suggestion for what else it should include? Write to tomek@ttechou.com or on X: @TomaszPacz42169.
Tomasz Paczóski
Reports and content published on this blog are for educational and analytical purposes only. They do not constitute investment advice or an instruction to trade. Past results do not guarantee future performance. Trading derivatives carries a high risk of losing capital.