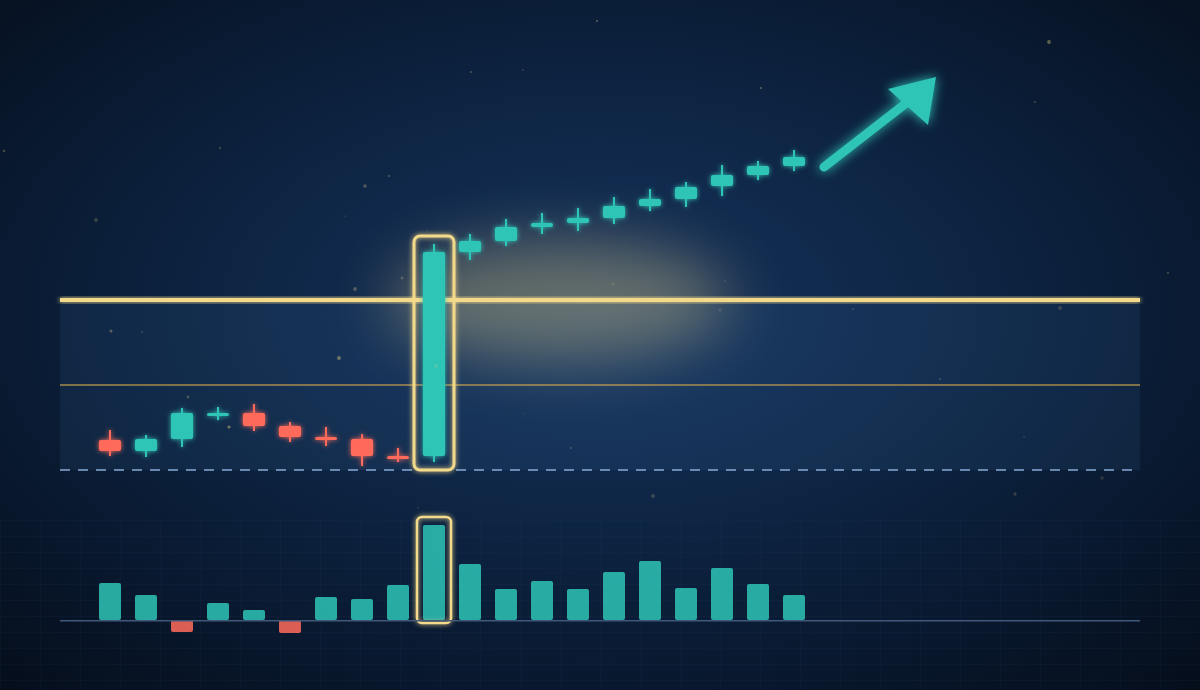
This is the first post in our series on the setups from our market report.
Each setup in the report has its own code. The letter is the type of situation, and the digit is the direction: 1 is long, 2 is short.
We’re starting with code Y. It’s the simplest to describe, has very clear rules, and in our test it produced one of the most interesting results.
The idea in one sentence
Price leaves yesterday’s value area, and delta confirms that aggressive players are behind the move.
In our previous post we wrote that at the edge of the value area the market has to make a decision: rejection or acceptance.
Setup Y plays acceptance. When price closes an hour outside yesterday’s value and buyers (or sellers) are accelerating, the market often looks for new value further out instead of returning to the old one.
The rules
| Y1 (long) | Y2 (short) | |
|---|---|---|
| Yesterday’s session | any | any |
| Signal | an H1 bar closes above yesterday’s VAH, coming from inside the value area | an H1 bar closes below yesterday’s VAL, coming from inside the value area |
| H1 delta | positive and stronger than the hour before | negative and stronger than the hour before |
| Entry | at the close of the signal bar | at the close of the signal bar |
| Stop-loss | yesterday’s VAH − 0.25σ, but no closer than 0.5 × the average H1 range from entry | yesterday’s VAL + 0.25σ, but no closer than 0.5 × the average H1 range from entry |
| Target (TP) | 3.5R | 3.5R |
| Limit | one entry per direction per day | one entry per direction per day |
A few explanations:
- Yesterday’s VA is the value area of the previous full session: VAH, VAL and POC.
- σ is the standard deviation of hourly price moves. The 0.25σ buffer keeps the stop away from the edge itself, so ordinary noise doesn’t take it out.
- Average H1 range is the typical distance between the high and low of an hourly bar. A minimum stop of half that value prevents a stop so tight that the first ordinary bar knocks it out.
- R is the risk, the distance from entry to stop. A 3.5R target means the potential gain is 3.5 times the risk.
What it looks like on a chart
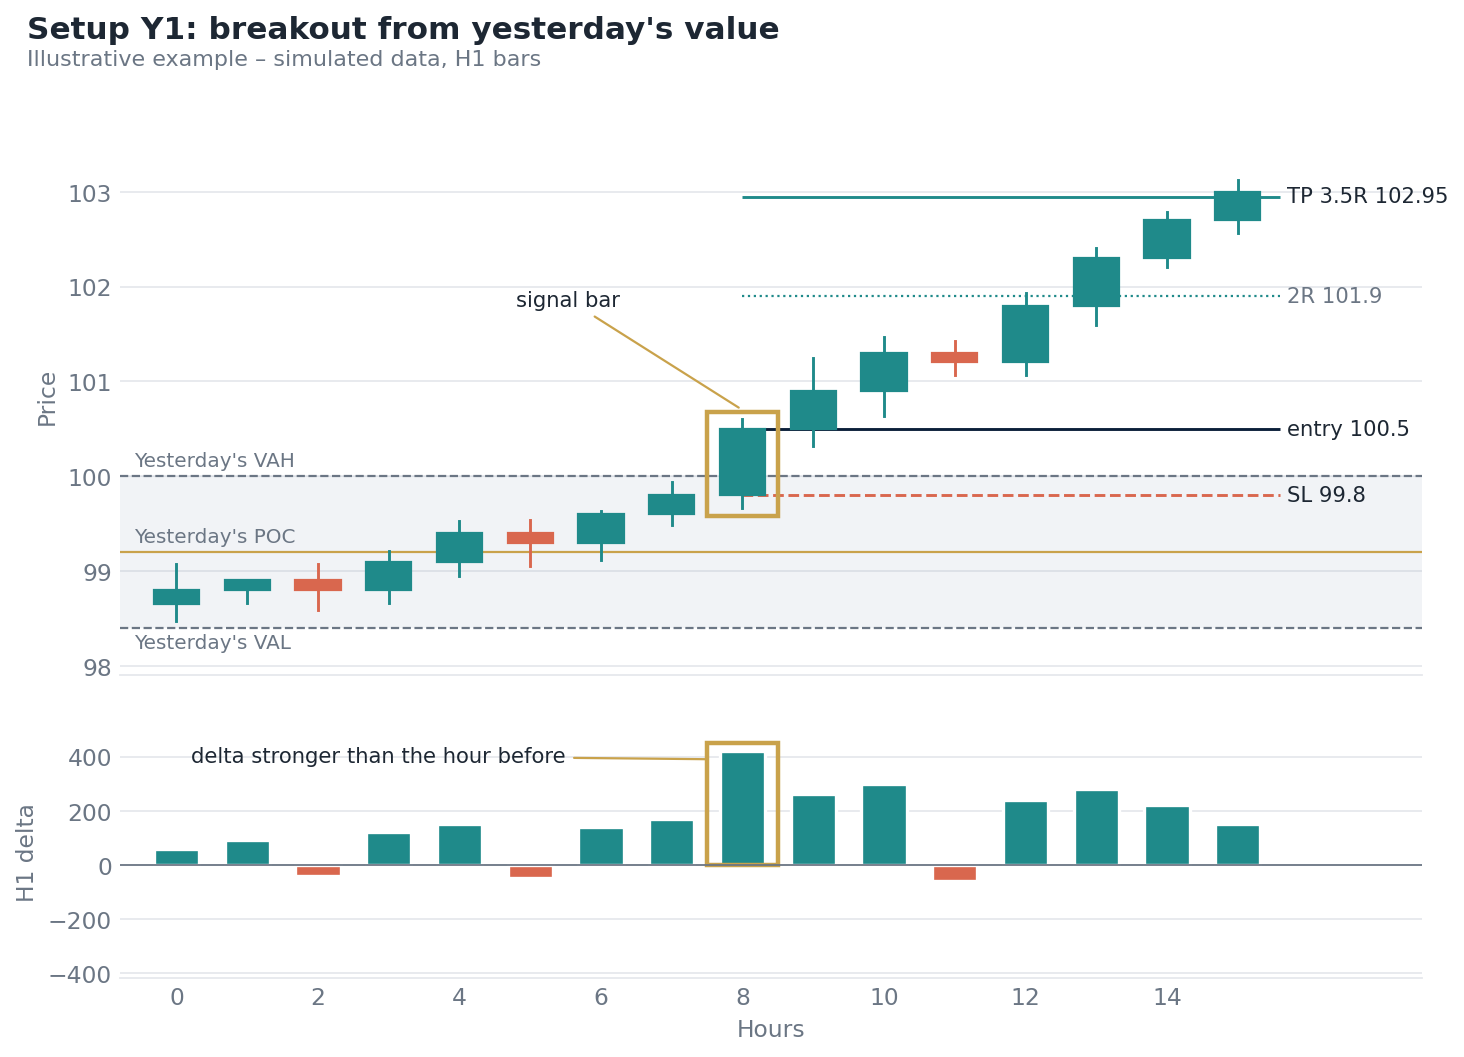
Illustrative example on simulated data. The signal bar closes above yesterday’s VAH, and its delta is clearly stronger than the hour before.
For several hours price rises inside yesterday’s value. Then one hour closes above VAH, and that hour’s delta is the highest of the session.
That’s the signal. We enter at the close of the bar.
A worked example
Let’s assume:
- yesterday’s VAH = 100.0,
- σ = 0.8, so the 0.25σ buffer = 0.2,
- average H1 range = 1.2, so the minimum stop = 0.6 from entry,
- the signal bar closes at 100.5.
Stop-loss: VAH − buffer = 100.0 − 0.2 = 99.8. That’s 0.7 from entry, more than the 0.6 minimum. The stop stays at 99.8.
Risk (R): 100.5 − 99.8 = 0.7.
3.5R target: 100.5 + 3.5 × 0.7 = 102.95.
Now a different case: the bar closes at 100.2, just above VAH. A stop at 99.8 would be only 0.4 from entry, below the 0.6 minimum. So the stop moves down to 99.6, R = 0.6, and the target is 102.3.
Why does delta have to be stronger?
Because simply crossing above VAH proves nothing.
Price can leave value on fading demand. That’s the classic failed breakout we described in the divergence post.
The condition “delta in the same direction and stronger than the hour before” means that at the moment of the breakout, the aggressive side is accelerating, not fading.
In our test this filter mattered. Without it there were more trades, but the result didn’t improve. The filter mostly removed breakouts where delta pointed against the move, and in the test those ended in losses.
An important detail: a crossing without rising delta doesn’t use up the signal. If the first hour above VAH has weak delta, we wait. The signal can still appear in a later hour, as long as price is still outside value and delta accelerates.
Why a 3.5R target and not 2R?
Because the results of this setup are bimodal.
Out of 11 trades in the test:
- 6 reached at least 3.5R,
- 4 didn’t even reach 1R, because the breakout immediately returned to value.
The breakout either works and the market runs far, or it fails quickly. There’s almost no middle ground.
With a distribution like that, taking profit early at 2R cuts off the best trades and does little to help the failed ones.
When the breakout fails
To be honest: almost half the signals in the test didn’t work.
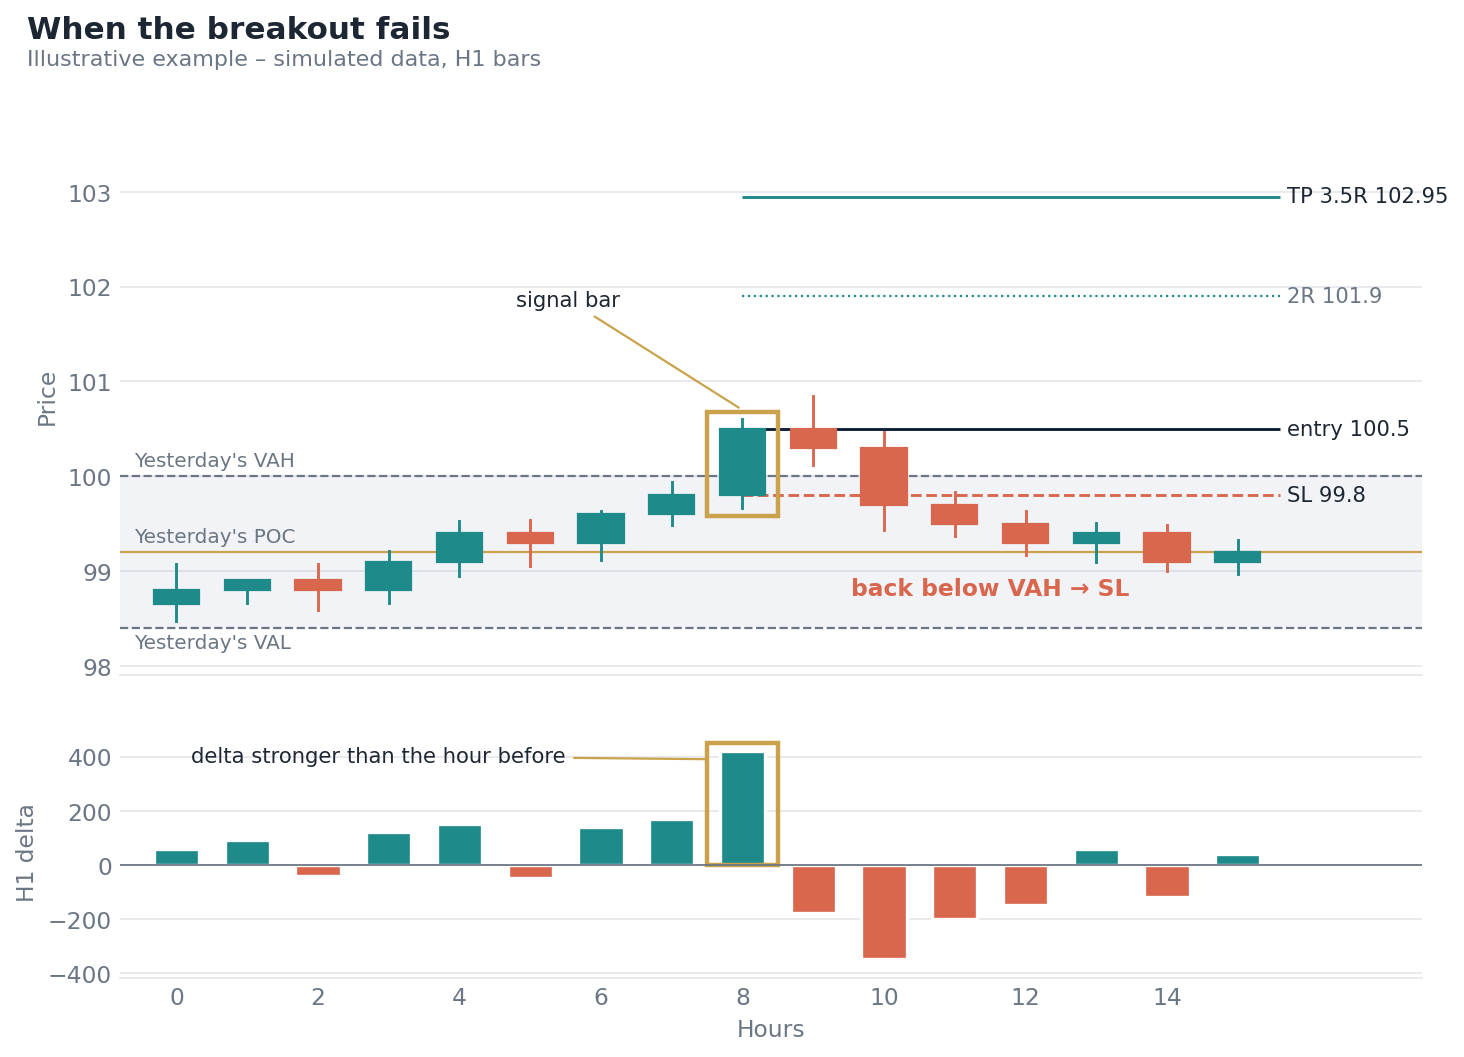
Illustrative example on simulated data. Despite strong delta on the signal bar, price returns to value and delta flips negative.
A failed breakout usually looks similar: right after the signal, delta flips sign and price falls back below VAH. The market didn’t accept higher prices.
That’s why the stop sits just below the edge of value. If price returns inside, the acceptance scenario is off and there’s no reason to stay in the position.
Test results
We tested code Y on 19 sessions of hourly data (US500, GOLD and RTY) from 14.09 to 02.10.2026. Entry was at the bar close, and positions were held for a maximum of 8 hours. Results are net of costs.
| Variant | Trades | Winners | Result |
|---|---|---|---|
| TP 3.5R (adopted) | 11 | 6 | +16.8R |
| TP 2R | 11 | 7 | +10.8R |
| TP 4R | 11 | 6 | +17.5R |
| ½ position at 2R + ½ at 4R | 11 | 7 | +14.6R |
| no delta filter (TP 2R) | 15 | 9 | +10.9R |
| control: trading against the breakout | 11 | 1 | −7.8R |
The most important row is the last one. Trading against the breakout produced a clear loss. On this data, a breakout from yesterday’s value with rising delta continued more often than it reversed.
Without the single best trade, the 3.5R variant still gives +13.4R. So the result doesn’t hinge on one lucky shot.
But: 11 trades is a small sample. It’s a promising signal, not proof. That’s why we keep tracking code Y live in our reports, and we’ll publish the results from the coming months, including if they turn out worse.
Y alongside the other setups
In the report, codes work independently, but Y has two relationships worth knowing:
- Y1 and P2 are mutually exclusive in the same hour. P2 (return to POC, short) requires a close below VAH, while Y1 requires a close above VAH. They can’t happen at the same time.
- K1 can join later. The continuation setup needs more confirmation, so it often appears after Y1 as a separate code.
Y gets into the move earliest of all the breakout setups. That’s its strength, and also the reason some of its signals turn out to be false.
What it looks like in Delta Analyzer®
To track setup Y in Delta Analyzer®, you need three things:
- VAH, VAL and POC from the previous session, the signal levels,
- hourly delta, to check whether the signal hour is stronger than the one before,
- cumulative delta, which shows whether the aggressive side keeps dominating after the breakout.
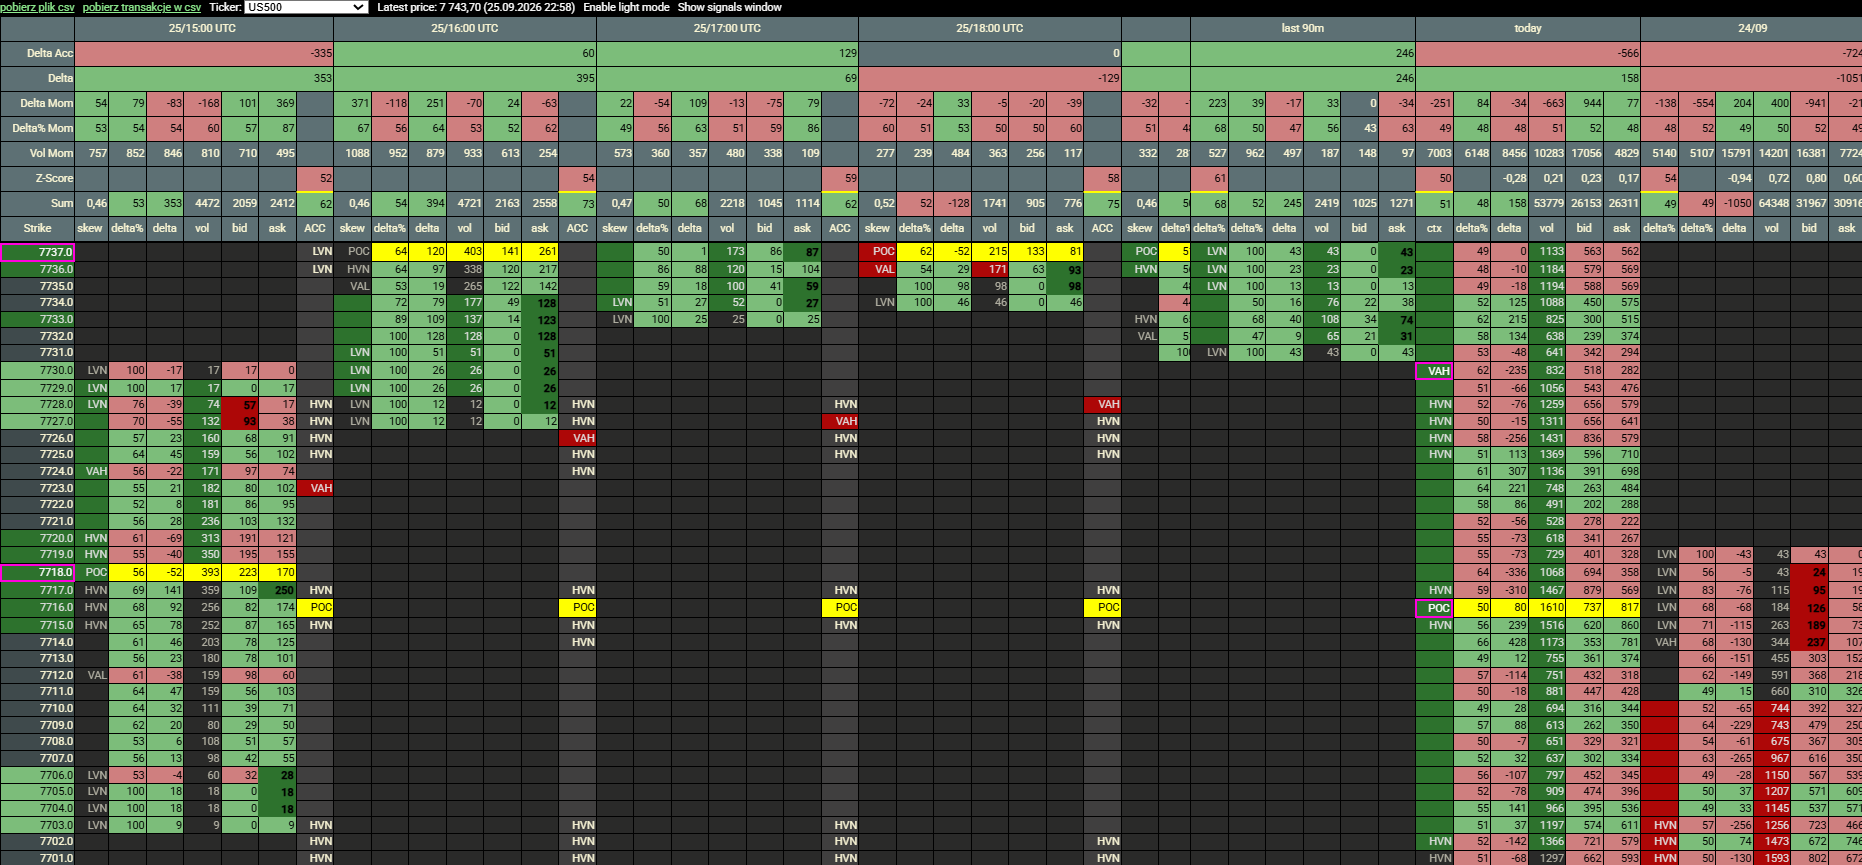
Delta Analyzer®: breakout from yesterday’s value with rising delta.
Summary
- Y is an acceptance setup: price leaves yesterday’s value while delta accelerates.
- Entry at the close of the signal bar, stop just beyond the edge of value, target 3.5R.
- Results are bimodal: the breakout either runs far or fails quickly.
- The test is promising, but the sample is small. We keep tracking it live.
Our reports show levels and scenarios. They are market analysis, not an instruction to place a trade.
What’s next?
In the next post in the series we’ll cover another setup from the report.
Have a question about setup Y, or spotted it in your own market? Write to tomek@ttechou.com or on X: @TomaszPacz42169.
Tomasz Paczóski
Content published on this blog is for educational purposes only and does not constitute investment advice. Past test results do not guarantee future performance. Trading derivatives carries a high risk of losing capital.