My name is Tomasz Paczóski. I am a trader and the founder of ttechou.com.
Before I started building tools for others, I spent years losing money in the markets. This post is about how I moved from chaos to a method built on data and testing.
The beginning: forex and blown accounts
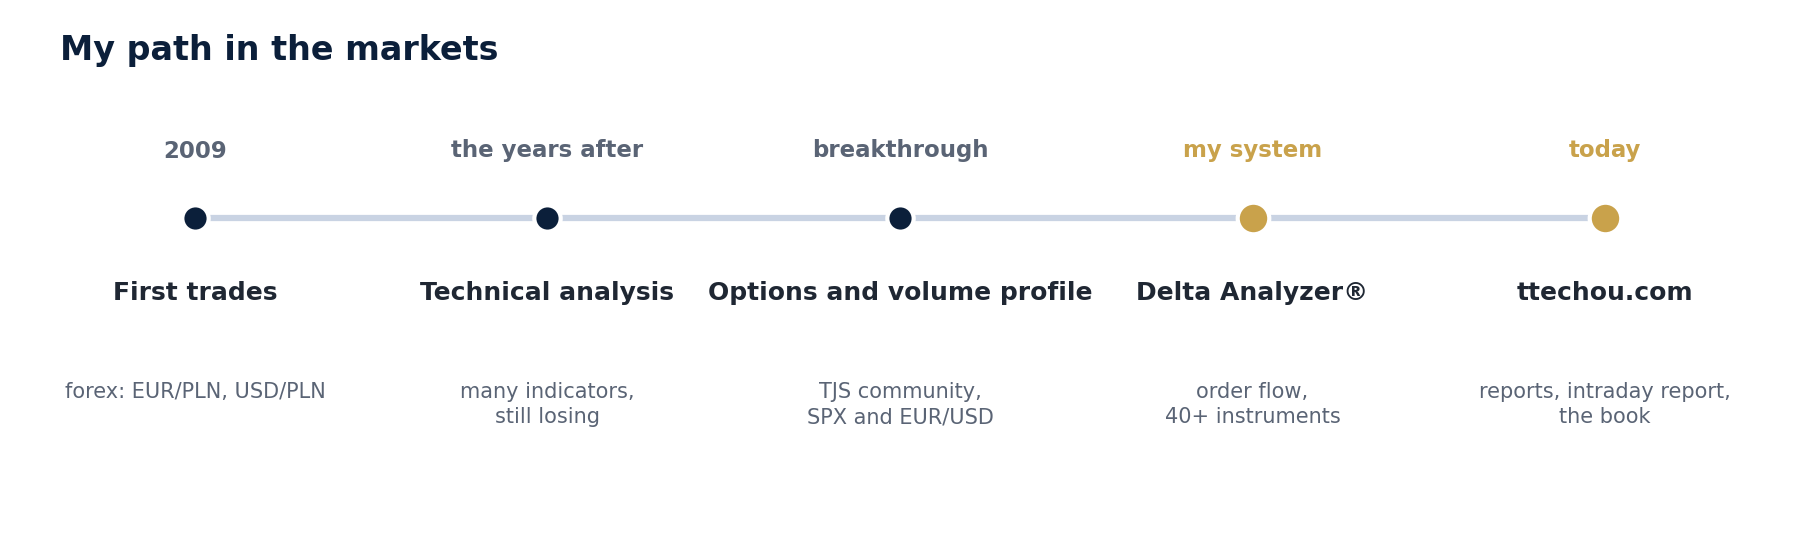
I have been interested in the markets since 2009. My first trades were on forex, on EUR/PLN and USD/PLN.
My trading back then was chaotic. Looking back, I can honestly say it was close to gambling.
There were wins and losses, but far more losses. I blew my account several times. That was when I started looking for answers to what this was all really about.
Technical analysis: more indicators, the same losses
I discovered technical analysis. Elliott, Fibonacci, Ichimoku, support, resistance, trend lines, MACD and stochastic became my daily bread.
More and more indicators appeared on my chart, but the problem stayed the same: the decision to buy or to sell. I kept losing.
Today I know why. Most indicators are calculated from price movement, so they show what has already happened. Reacting to them is always late.
It took me several years to understand how the market really works.
The breakthrough: options and volume profile
The breakthrough came when I joined the TJS community. It was my colleagues at TJS who advised me to look at options and at how they move price.
My second discovery was the volume profile. Dozens of indicators disappeared from my chart. Only a few remained:
- volume profile,
- footprint,
- the tape (time and sales),
- cumulative delta,
- support, resistance and a price channel.
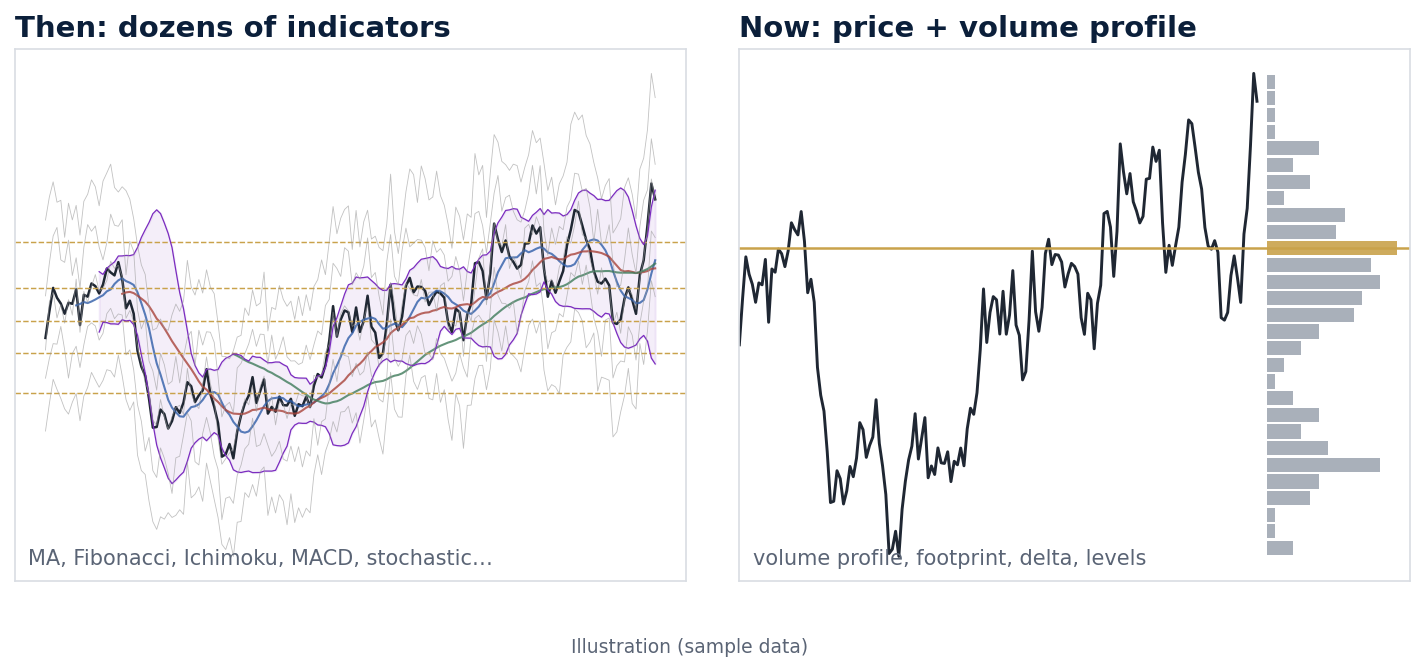
I also stopped trading many instruments. Two remained: the S&P 500 (cash SPX) and EUR/USD. That gave me time to analyse them properly.
My system: Delta Analyzer®
Options and volume profile taught me to read the market through volume and order flow, not through indicators calculated from price. That path led to Delta Analyzer® – the tool Michał Babiński and I built, and the one I work with today.
What it shows:
- order flow – delta (ask − bid), the day’s cumulative delta and delta over the last 60 minutes,
- volume profile – POC, value area (VAH, VAL), profiles of the day, previous sessions and the week,
- footprint – bid and ask volume at every price level,
- two views – Daily for planning the session and Scalping for working during the day,
- more than 40 instruments – indices, currencies, commodities and crypto.
How I use it:
- In the evening I mark levels for the next session: the previous day’s value area and POC, volume zones and liquidity zones.
- During the day I watch what the market does at those levels: does it accept value higher or lower, or return to the middle?
- When a level breaks, I check the delta. If the flow goes against the break, I treat it as a warning, not as an entry.
Delta Analyzer® records data every minute. We use the same data for our reports and for every test I describe below.
From my own trading to tools
Professionally, I run my own company.
Over time I realised that what I had been looking for for years could help other traders too. That is how ttechou.com (formerly gramy-pod-opcje.pl) was born, which I build together with Michał Babiński.
What we do today:
- Delta Analyzer® – described above, available to traders on ttechou.com.
- Market reports – value levels, liquidity zones, volatility and order flow for the next session.
- Intraday report – every hour it shows how the market behaves around those levels.
- The book “Order Flow i Volume Profile” – Michał and I are writing it together. It explains how to read the market’s intent and combine it with options data.
ttechou.com intraday report – US500, 19 Oct 2026
How I work: test first, publish second
I don’t believe in a holy grail and I don’t sell signals.
Everything I show to traders, I first check on historical data. I compare it with a random control. If it does not stand out from chance, it does not go into the report, even when it is popular.
That is how nPOCs, POC as a “magnet” for price and classic delta divergence were dropped. What stayed is what has numbers behind it: liquidity zones with a delta check at the break, and value acceptance.
I publish my results on X as @TomaszPacz42169. I show the weaker ones too, because without them the numbers mean nothing.
What over a decade in the markets has taught me
Trading is hard work. It takes discipline and patience.
There is no holy grail. Losses are part of every trader’s day, and you have to accept that.
What you can have is an edge: knowing where the market has a reason to react, and sticking to what has been tested. I searched for that edge for years. Today I help others find it.
If you want to see how this works in practice, visit ttechou.com or follow me on X.
For information and education only. This is not investment advice. Trading financial instruments involves the risk of losing capital.