Tuesday, 19:29 Polish time (17:29 UTC). US500 is at 7,722.
On the price chart, the last three hours looked nervous. Price dropped from around 7,727 to 7,708 and then came back up. If you only look at candles, it could have been a scare.
I’m holding my long. Here’s why, based on what Delta Analyzer® shows.
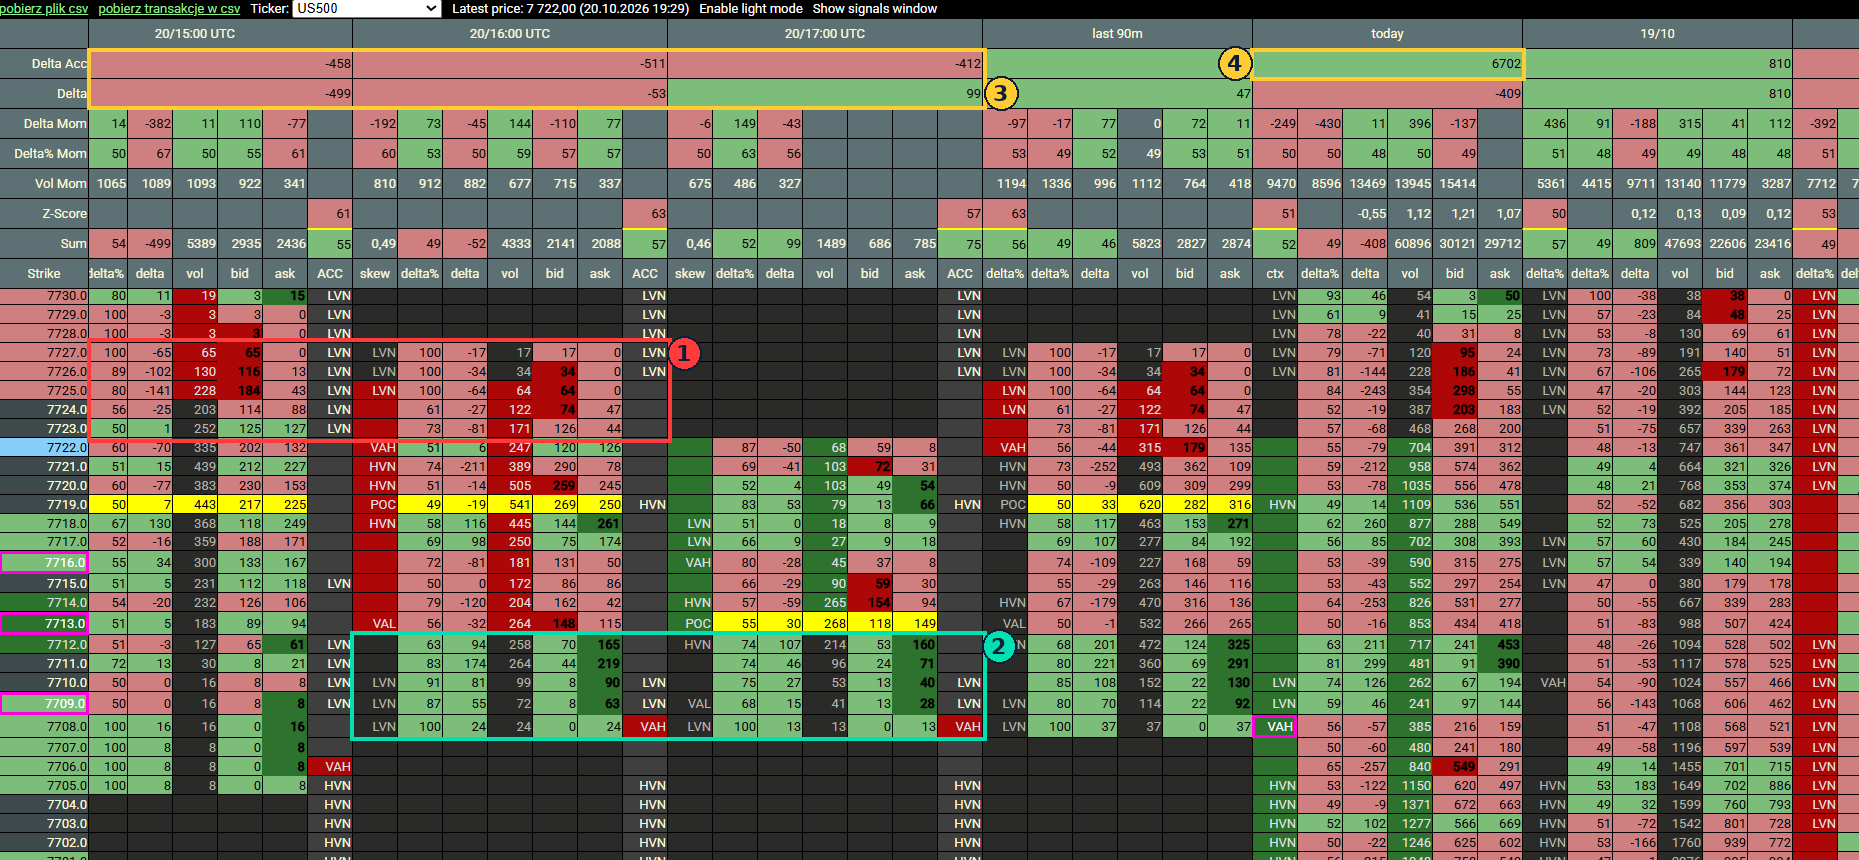
Delta Analyzer®, US500, 20.10.2026, 19:29 Polish time. Columns: the 15:00, 16:00 and 17:00 UTC hours (17:00, 18:00 and 19:00 Polish time), the last 90 minutes, the “today” column (in the Delta Acc row, the 10-day cumulative delta), and the previous session (19.10). Boxes 1–4 are explained below.
1. The big picture: 10 days on the buyers’ side
I start with context (box 4).
The cumulative delta for the last 10 days is +6,702. Over that period, aggressive buyers clearly outweighed sellers.
That’s the backdrop against which I read today’s session. The bigger picture belongs to the buyers, so for me today’s weakness is a pullback within that picture, until the data shows otherwise.
2. The day: sellers weakening hour by hour
Today’s session isn’t clearly on the buyers’ side. The day’s cumulative delta is negative: −412. That’s why what matters more than the number itself is how it’s changing (box 3):
| Hour (UTC) | Hour (Polish time) | Hourly delta | Day’s cumulative delta |
|---|---|---|---|
| 15:00 | 17:00 | −499 | −458 |
| 16:00 | 18:00 | −53 | −511 |
| 17:00 (in progress) | 19:00 | +99 | −412 |
Last 90 minutes: +47.
The pullback started with heavy selling: −499 in a single hour. In the next hour, sellers managed only −53. In the current hour, buyers have the edge.
The day’s cumulative delta dropped to −511 and is now rebounding to −412. The day is still negative, but selling has stopped building and is starting to reverse.
That’s a classic picture of an exhausted pullback. Sellers tried, but had less strength with every hour.
3. The top of the range: that’s where sellers sit
Box 1 covers 7,723–7,727 in the 15:00 and 16:00 UTC hours.
Almost every cell there is red. At 7,725–7,727, selling made up 80–100% of the volume at each level, for example at 7,725: 184 contracts at the bid versus 43 at the ask.
Takeaway: 7,723–7,727 is a zone where sellers have already defended once. It’s the nearest resistance and the first place I’ll check whether buyers have the strength to go further.
4. The bottom of the range: that’s where buyers defend
Box 2 covers 7,708–7,712 in the 16:00 and 17:00 UTC hours. This is the most important part of the screen.
Whenever price dropped to the bottom of the range, aggressive buyers stepped in every time:
- 7,711 at 16:00 UTC: 219 contracts at the ask versus 44 at the bid, delta +174,
- 7,712 at 17:00 UTC: 160 at the ask versus 53 at the bid, delta +107,
- 7,708–7,710: buying made up 68–100% of the volume at each level in both hours.
The “today” column shows a similar picture: 7,710–7,712 are among the most heavily bought levels (e.g. 7,711: 390 at the ask versus 91 at the bid).
This zone isn’t random. 7,708 is the VAH of the daily profile, the upper edge of the value area (marked as VAH in the ACC and “last 90m” columns). For the last three hours, price has dropped to this level and bounced off it every time.
In volume profile terms, this is a retest of the upper edge of value from above. The market moved above daily value, came back to test it, and buyers defended it with aggressive buying. That’s a picture of acceptance of higher prices, not a return to old value.
That’s the answer to the question in the title. The pullback reached the daily VAH at 7,708, and that’s where buyers took the initiative. Sellers couldn’t push price back into daily value, even though they attacked hardest in the 15:00 UTC hour.
5. Where price is now
At 7,722, price is:
- above the current hour’s value: the 17:00 UTC POC is 7,713, and its VAH is 7,716,
- at the upper edge of value from the 16:00 UTC hour: POC 7,719, VAH 7,722,
- about 14 points above the daily VAH (7,708), which it has been bouncing off for three hours,
- just below the sellers’ zone from box 1.
The market came back from the bottom of the range to the top with positive delta. Buyers have retaken the ground sellers took during the pullback.
Summary: why I’m holding
- The bigger picture belongs to buyers: 10-day cumulative delta +6,702.
- The pullback weakened: hourly delta −499 → −53 → +99, and the day’s cumulative delta is rebounding from −511 to −412.
- For three hours, price has been bouncing off the daily VAH (7,708), and aggressive buyers are defending that level.
- Price is back at the top of the range with positive delta.
Each argument on its own isn’t enough. Together they form a consistent picture: a pullback in a broader buyers’ trend, exhausted and bought back at the bottom.
What would change my mind
To be honest: this isn’t certainty. I’ll close or reduce the position if:
- price closes an hour below 7,708, meaning it falls back below the daily VAH into daily value. Then the retest has failed and the buyers’ defence has broken,
- hourly delta drops sharply again, as at 15:00 UTC, and the day’s cumulative delta falls below −511, making a new low,
- absorption appears at 7,723–7,727: heavy positive delta, but price can’t break the zone. That would be a sign sellers are defending again.
If buyers break through 7,727 with positive delta, the sellers’ zone from box 1 stops working, and that’s an argument for holding further.
My position
- Entry: 7,705
- Stop-loss: 7,699
- Target: 7,815
The risk is 6 points, and the potential gain is 110 points. The stop sits below the daily VAH (7,708) with a buffer, so if the retest of that level fails, the loss is small.
This post is about how I read the market, not a signal to copy.
Have a question, or do you see something different in this data? Write to tomek@ttechou.com or on X: @TomaszPacz42169.
Tomasz Paczóski
This post presents my personal analysis and decision. It does not constitute investment advice or an encouragement to trade. Trading derivatives carries a high risk of losing capital.